
Gold Price Weekly Forecast – Bullish
- Gold rally continues, fresh highs underpinned by geopolitical fears.
- The precious metal is ignoring US data.
Download our brand new Q2 Gold Technical and Fundamental Forecasts below
Recommended by Nick Cawley
Get Your Free Gold Forecast
Most Read: Gold Breakout Nears as Bullish Pennant Pattern Forms
Gold is ending the week in unchartered territory as traders look to hedge against a further escalation of tensions between Israel and Iran. Earlier this week at least eleven Iranian people were killed, including a senior commander of the Islamic Revolutionary Guard Corps, with Iran now vowing to take retaliatory action against Israel. According to newspaper reports, Israel is preparing itself for imminent missile attacks from Iran, an action that will further heighten political instability between the two countries.
When geopolitical tensions rise, investors looking to become risk-averse seek the safety of gold. Geopolitical tensions can lead to economic stability and rising inflation and gold has a history of preserving wealth during times of instability. The ongoing troubles in the Middle East are forcing the price of oil ever higher, fueling inflationary fears, and adding to gold’s allure.
Brent Crude Prices Hit $90/Barrel as Geopolitical Tensions Flare Up
Along with a fundamental risk-off bid, gold has seen a technical bullish pennant pattern play out, sending the precious metal ever higher. While this technical setup has now played out, the downside for gold looks limited in the short term.
Gold Breakout Nears as a Bullish Pennant Pattern Forms
The outlook for gold over the coming days remains positive but further highs will remain dependent on the situation in the Middle East. The next level of resistance will likely be ‘big figure resistance’ at $2,500/oz. although to reach there the CCI indicator – at the bottom of the daily chart – needs to move out of overbought territory. Initial support is seen at $2,300/oz. before two recent lows and one recent high around $2,268/oz. come into focus.
Recommended by Nick Cawley
How to Trade Gold
Gold Daily Price Chart
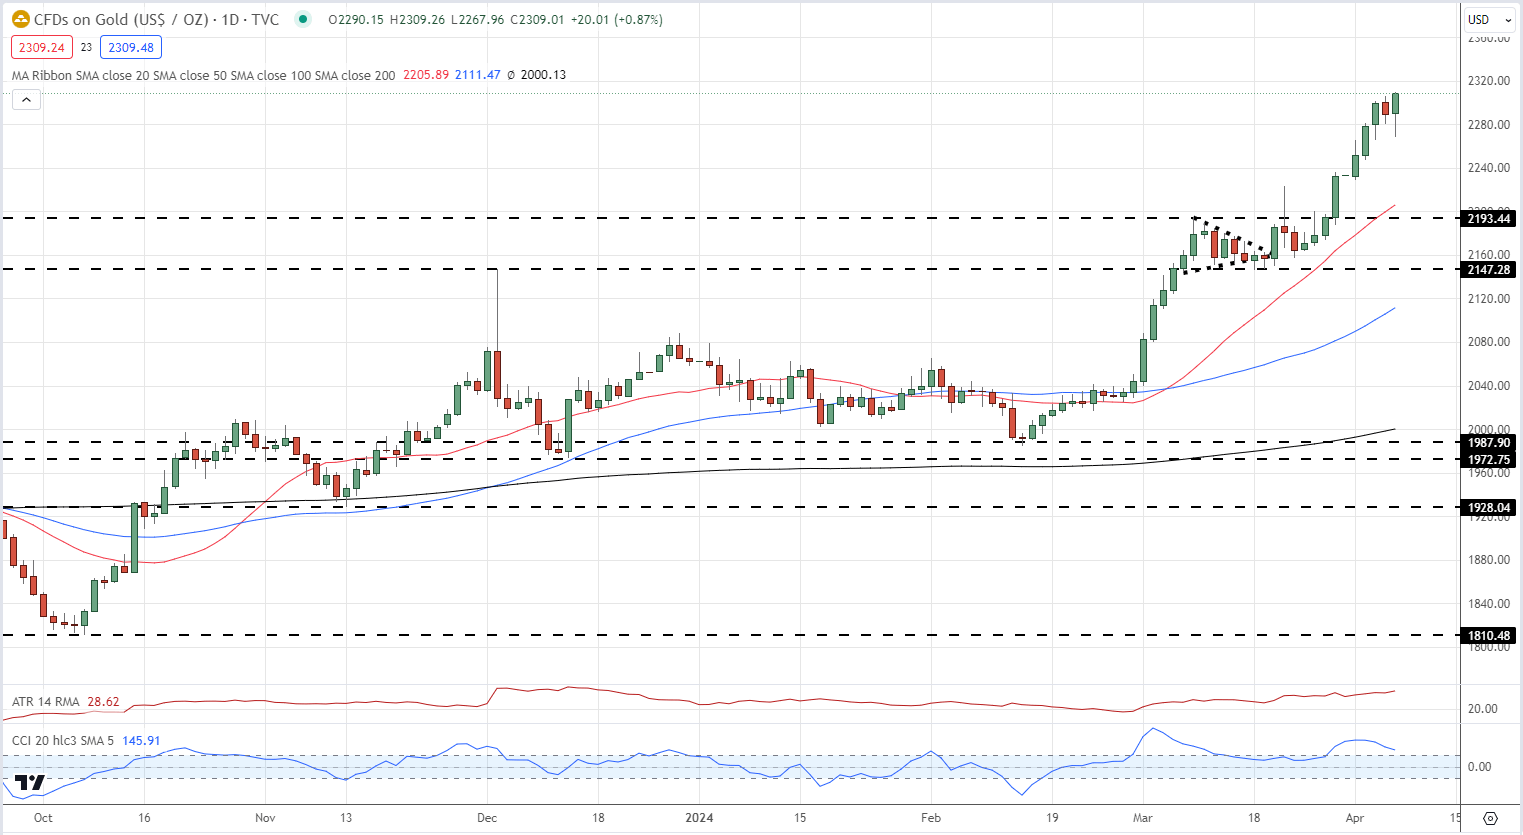
Chart via TradingView
Retail trader data shows43.87% of traders are net-long with the ratio of traders short to long at 1.28 to 1.The number of traders net-long is 1.06% higher than yesterday and 13.69% higher than last week, while the number of traders net-short is 5.61% lower than yesterday and 8.50% higher than last week.
We typically take a contrarian view to crowd sentiment, and the fact traders are net-short suggests Gold prices may continue to rise.
| Change in | Longs | Shorts | OI |
| Daily | 5% | 5% | 5% |
| Weekly | 3% | 1% | 2% |
What is your view on Gold – bullish or bearish?? You can let us know via the form at the end of this piece or contact the author via Twitter @nickcawley1.