
Ethereum price is showing bullish signs above the $2,720 support. ETH eyes more gains and might surge toward the $3,000 resistance zone.
- Ethereum is consolidating gains above the $2,780 support zone.
- The price is trading above $2,800 and the 100-hourly Simple Moving Average.
- There are two bullish trend lines forming with support at $2,825 and $2,780 on the hourly chart of ETH/USD (data feed via Kraken).
- The pair could continue to move up toward the $3,000 resistance zone.
Ethereum Price Eyes More Gains
Ethereum price gained pace above the $2,750 pivot level. ETH bulls were able to pump the price above the $2,800 resistance zone. It even spiked above $2,850 before the bears appeared.
A new multi-week high was formed at $2,869 before there was a downside correction, like Bitcoin. There was a minor move below the $2,850 level. Ether dipped below the 23.6% Fib retracement level of the recent wave from the $2,728 swing low to the $2,869 high.
The bulls are now active above the $2,800 level. Ethereum is now trading above $2,800 and the 100-hourly Simple Moving Average. There are also two bullish trend lines forming with support at $2,825 and $2,780 on the hourly chart of ETH/USD.
Immediate resistance is near the $2,880 level. The first major resistance is near the $2,920 level. The next major resistance is near $2,940, above which the price might rise and test the $3,000 resistance.
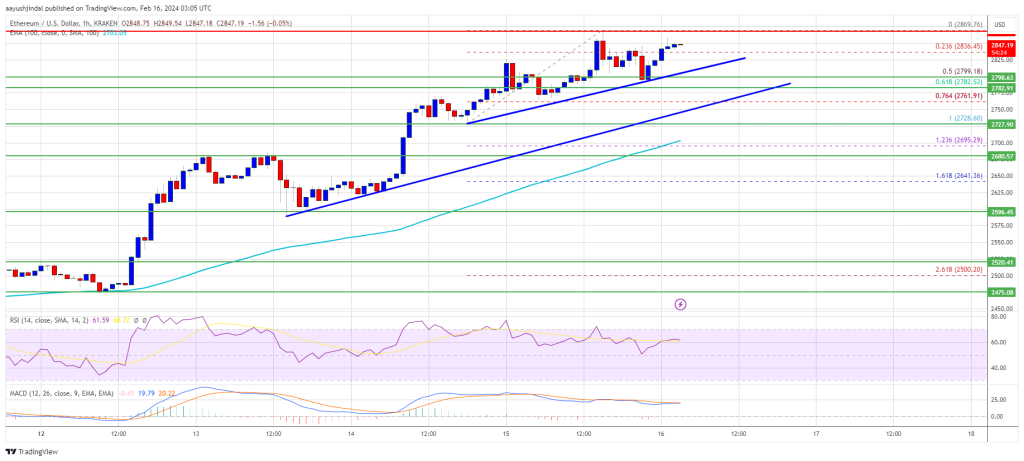
Source: ETHUSD on TradingView.com
If the bulls push the price above the $3,000 resistance, Ether could even rally toward the $3,120 resistance. In the stated case, the price could rise toward the $3,250 level.
Are Dips Supported In ETH?
If Ethereum fails to clear the $2,880 resistance, it could start a downside correction. Initial support on the downside is near the $2,825 level and the first trend line.
The next key support could be the $2,780 zone or the second trend line. It is close to the 61.8% Fib retracement level of the recent wave from the $2,728 swing low to the $2,869 high. A clear move below the $2,780 support might send the price toward $2,720. The main support could be $2,700 or the 100 hourly SMA. Any more losses might send the price toward the $2,600 level.
Technical Indicators
Hourly MACD – The MACD for ETH/USD is gaining momentum in the bullish zone.
Hourly RSI – The RSI for ETH/USD is now above the 50 level.
Major Support Level – $2,780
Major Resistance Level – $2,880
Disclaimer: The article is provided for educational purposes only. It does not represent the opinions of NewsBTC on whether to buy, sell or hold any investments and naturally investing carries risks. You are advised to conduct your own research before making any investment decisions. Use information provided on this website entirely at your own risk.