Dow Jones, S&P 500, Nikkei 225 Analysis and Charts
Dow slumps following CPI data
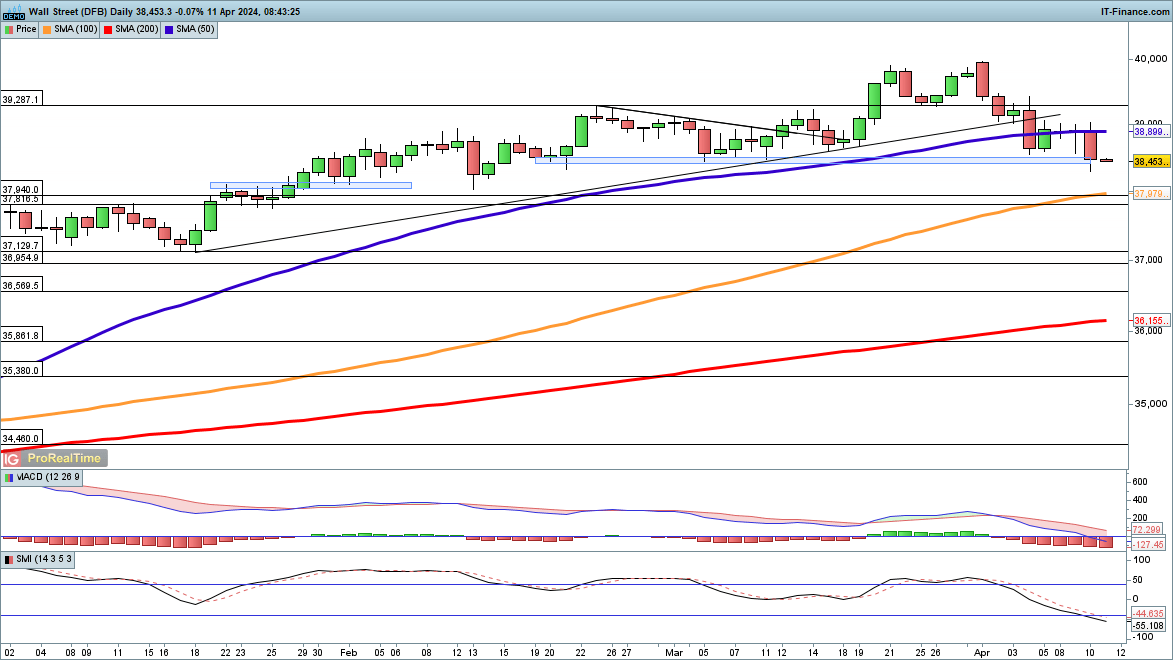
US inflation news yesterday sent Wall Street into a tailspin, and the Dow briefly hit its lowest level since 14 February.While the index is still barely two weeks away from its most recent record high, it has been unable to maintain upward momentum. Over the past week, the index has closed below the 50-day simple moving average (SMA) for the first time since early November.
Additional declines could see the price head towards the rising 100-day SMA, and to the 13 February low at 38,037. A close back above 39,000 might indicate that a low has been formed for the time being.
Dow Jones Daily Chart – April 11th, 2024
Our Q2 Equities Forecasts – Technical and Fundamental – are now available to download
Recommended by Chris Beauchamp
Get Your Free Equities Forecast
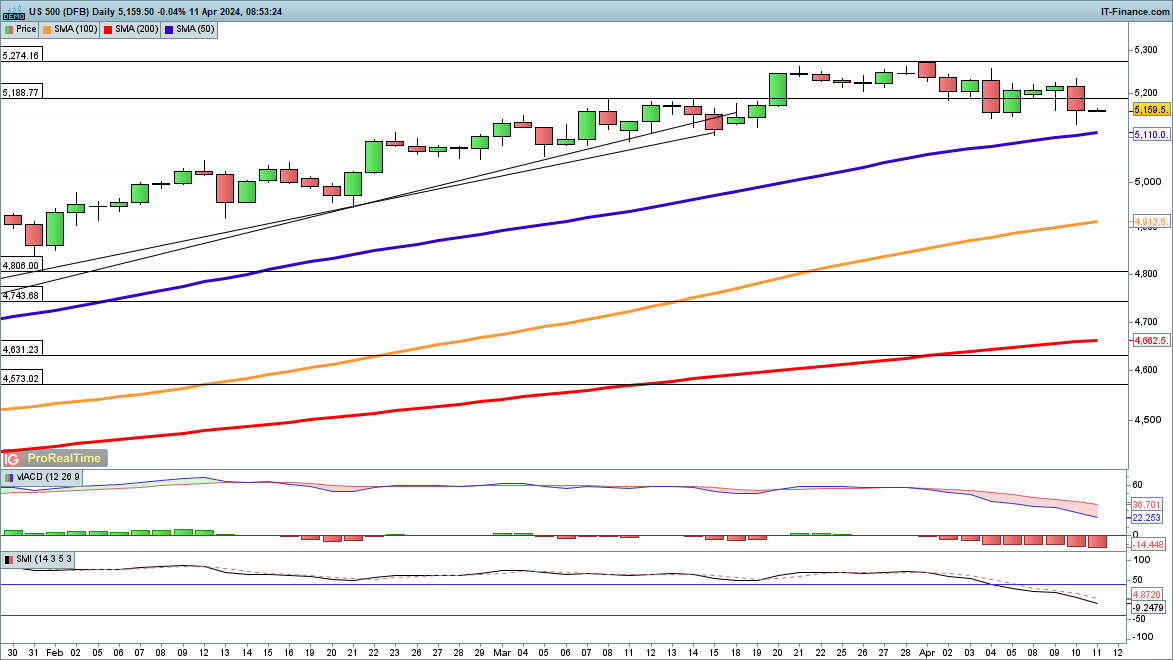
S&P 500 holds above 50-day MA
For this index the declines have been less dramatic, though slightly more drawn out. Wednesday’s session saw the price fall to a three-week low, but overall the uptrend from October remains intact. The S&P 500, unlike its bigger cousin the Dow, continues to hold above the 50-day SMA.
A close below the 50-day SMA could point towards more short-term weakness, while a recovery above 5250 could signal that a low is in place.
S&P500 Daily Chart – April 11th, 2024
See how Retail Sentiment data can help you make more informed trading decisions
| Change in | Longs | Shorts | OI |
| Daily | 4% | -2% | 0% |
| Weekly | -2% | -2% | -2% |
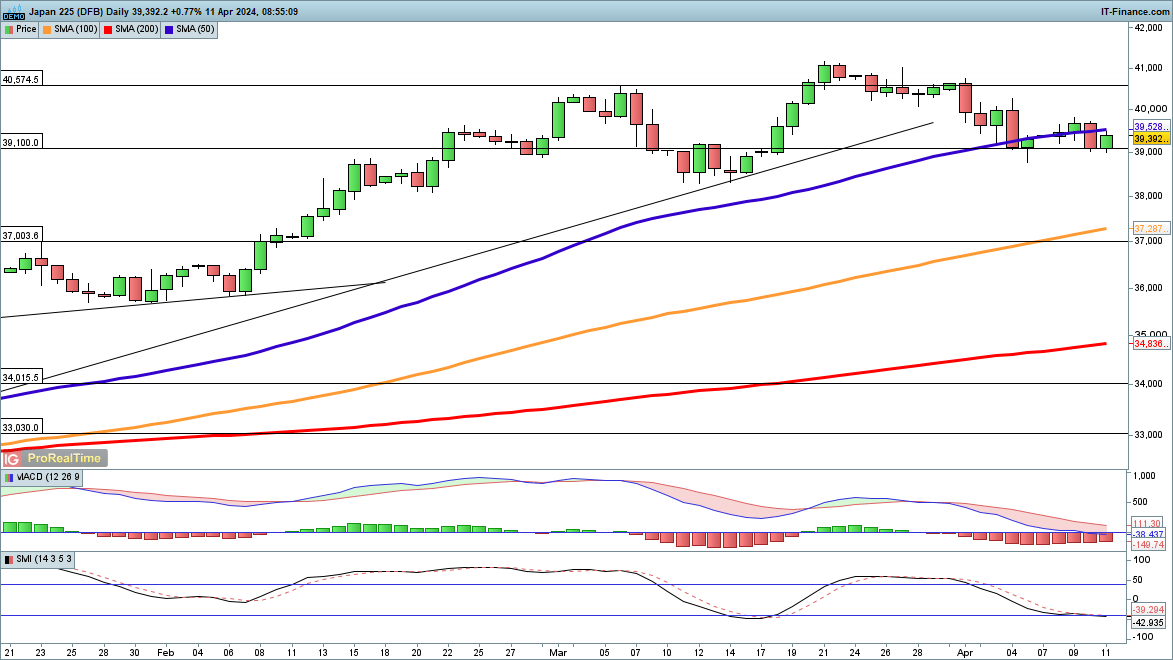
Nikkei 225 edges up from Wednesday’s low
Japanese markets were rocked by yesterday’s US CPI figure, but persistent yen weakness has helped limit the downside for the time being. Indeed, the Nikkei has managed to hold above the low seen last week at 38,771, though it has slipped below the 50-day SMA once more. A low may have formed if 39,000 can hold, and the index close above 40,000.
Further short-term weakness targets the early March low at 38,300.
Nikkei 225 Daily Chart – April 11th, 2024