
- Bitcoin whales and shrimps alike gathered more BTC in their wallets as sentiment swung bullishly.
- The expectations of a bull run after the halving was strong, which ironically could delay the run.
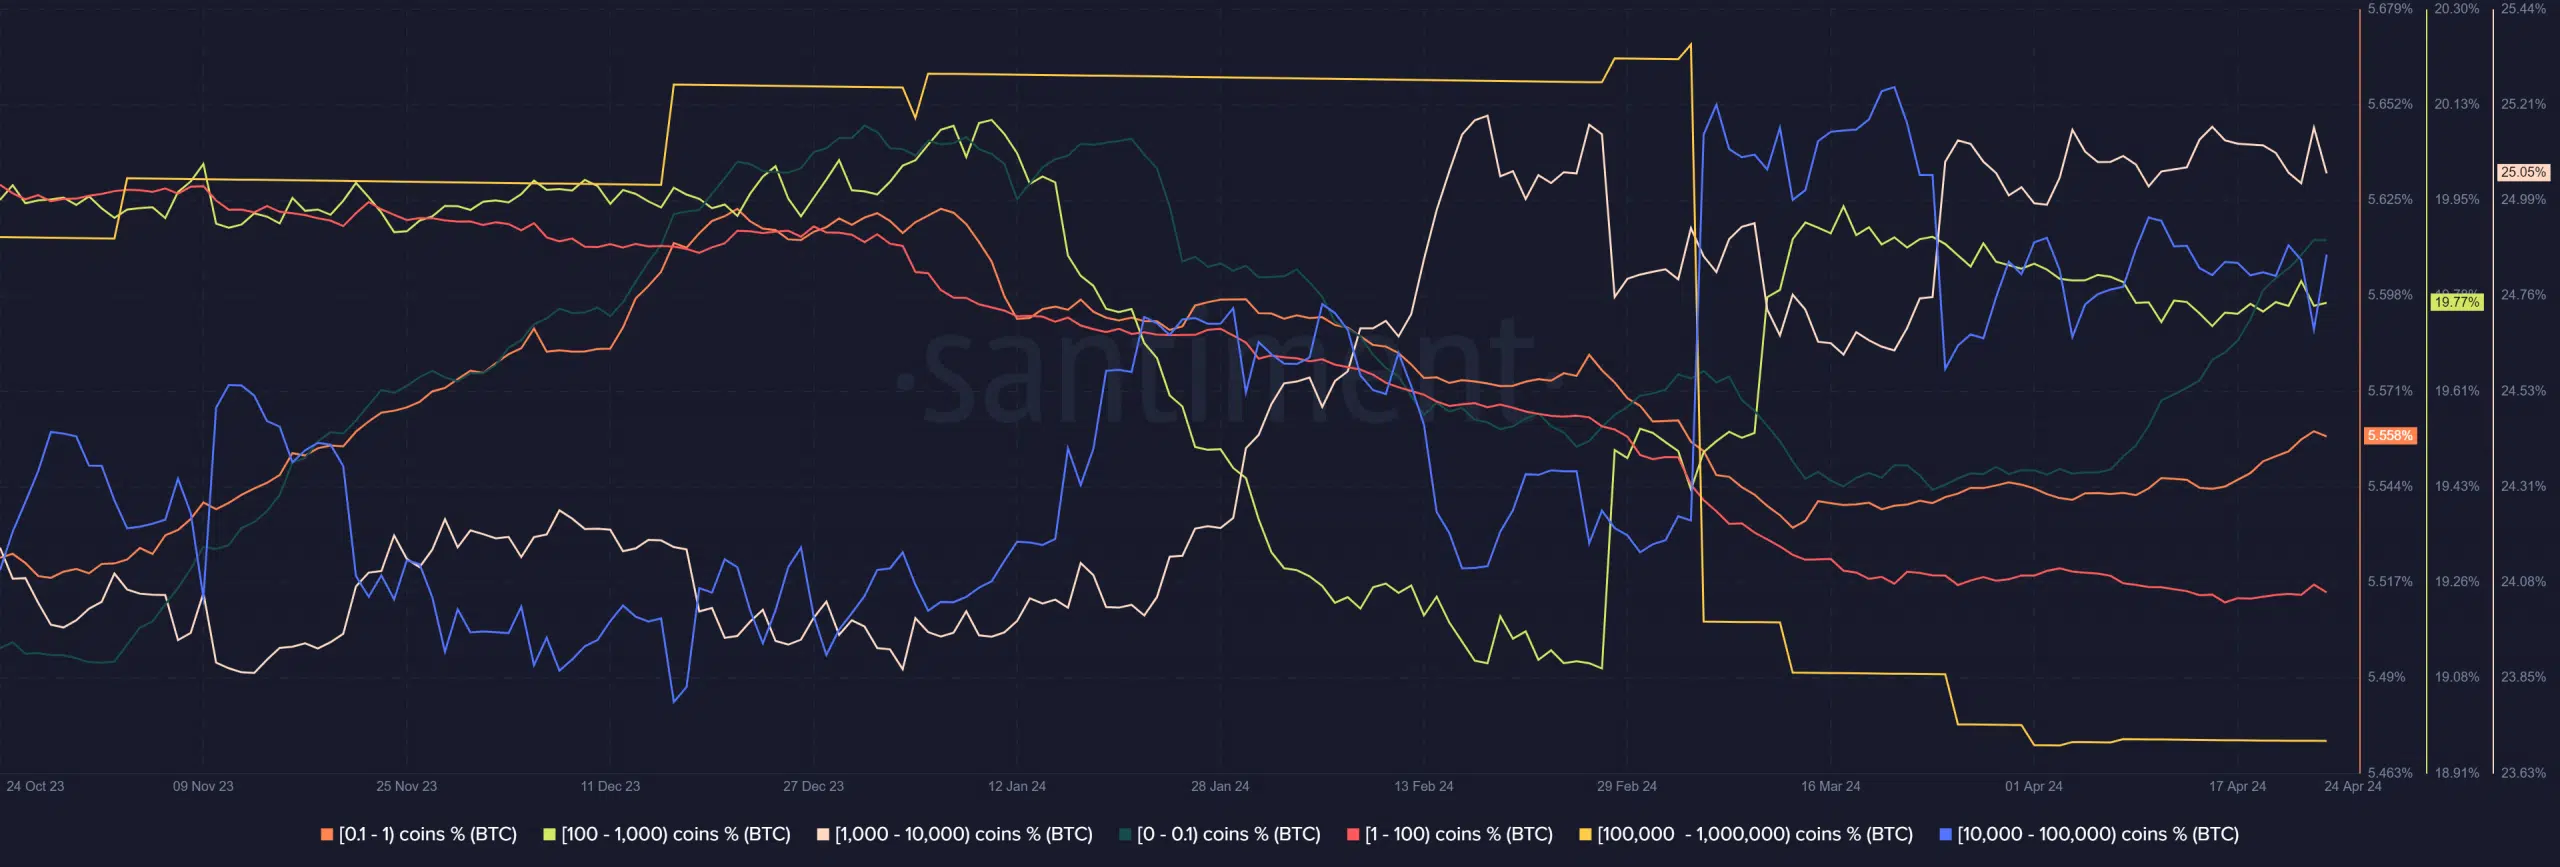
Bitcoin [BTC] accumulation trends showed encouraging signs. A Santiment post on X (formerly Twitter) underlined that the whale tier holding 1k-10k BTC has bought an additional 266k Bitcoin since the start of 2024.
AMBCrypto looked at relevant metrics and found signs of FOMO after the Bitcoin halving, with the Weighted Sentiment (1-week interval) also the highest it has been in 2024. However, some factors could hinder the bull run this summer.
BTC wallets in the 1k-10k whale tier resume their January trend
Source: Santiment
The supply distribution chart showed that the 1k-10k BTC holders (beige) spiked higher in March. The rise was not as large as the mid-January one but was still notable. In April, the metric continued to slowly climb higher.
The wallets with under 1 BTC (orange and green) were also rapidly accumulating in recent weeks. Their share of the supply was higher, while the 10k-1 million BTC holders were relatively stable in the past month.
Therefore, crowd FOMO is present, especially amongst the smallest tiers of BTC holders. These wallet tiers were eager to add more to their hoard in anticipation of price gains.
The halving event has spurred bullish sentiment, but history has a warning for us.
Comparing the current run to the previous one
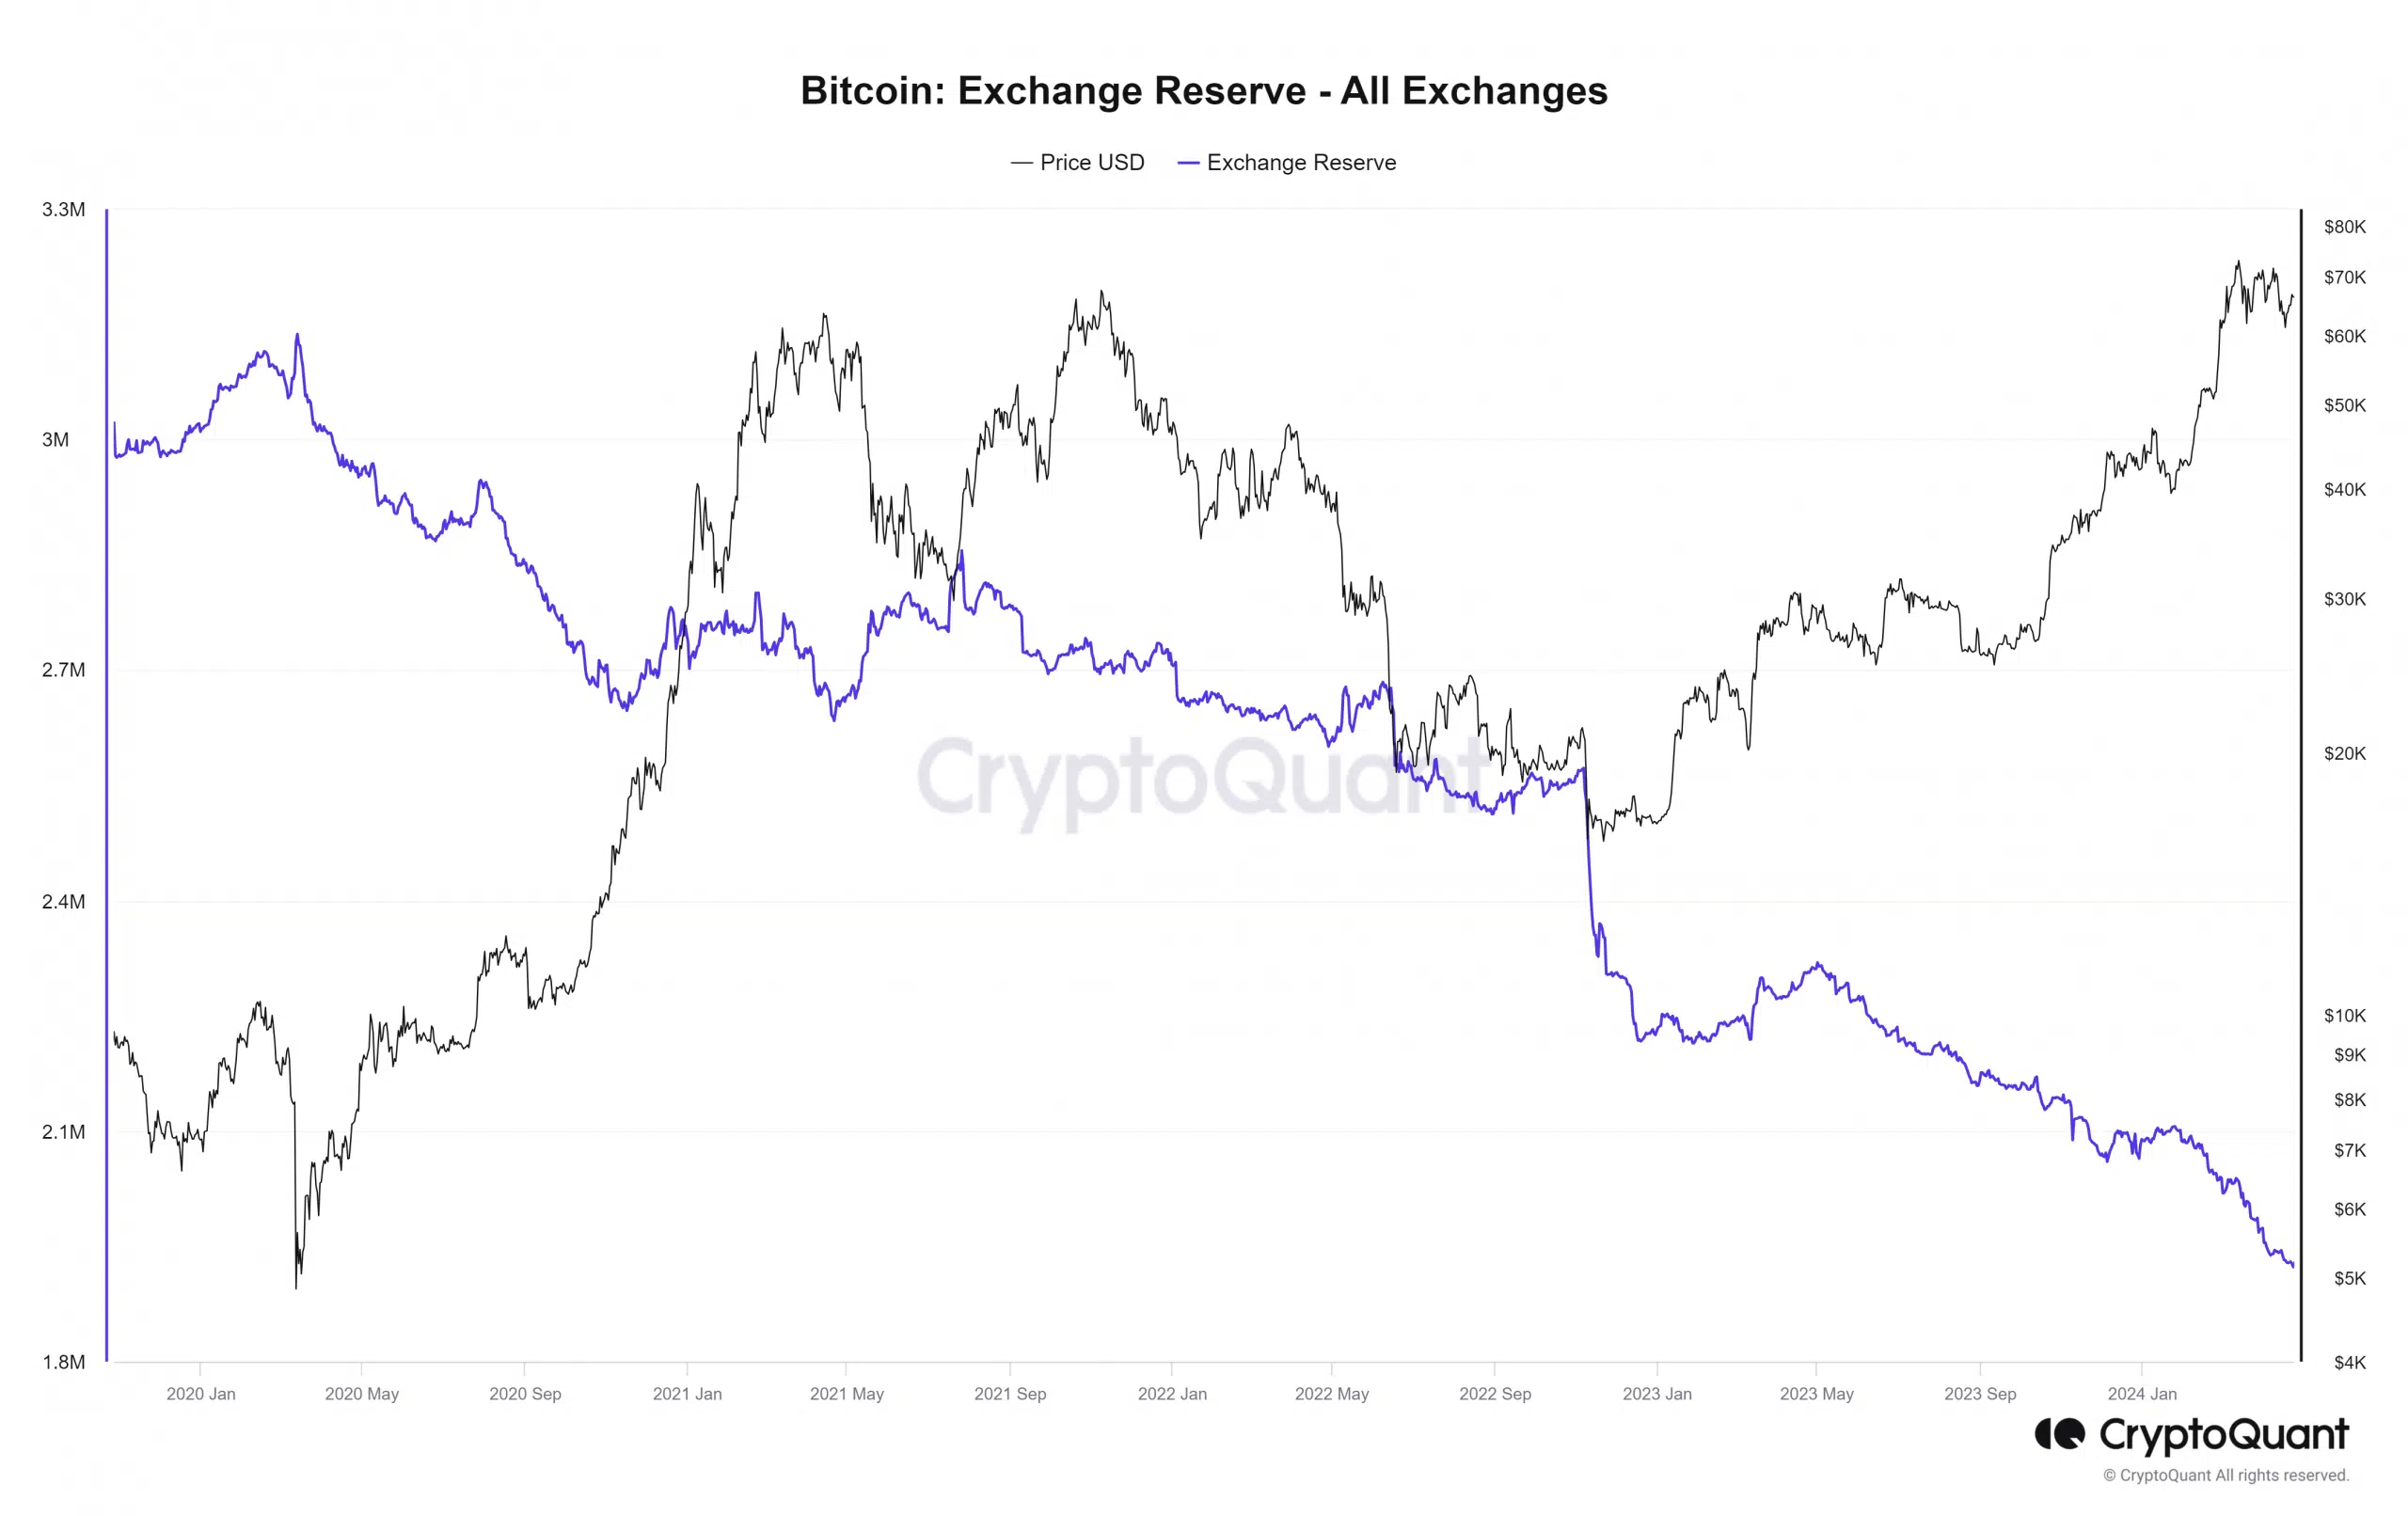
Source: CryptoQuant
The exchange reserve metrics track the amount of Bitcoin on exchanges. An increase in value would mean more Bitcoin is readily available for selling. It has trended downward in the past two years.
The 2020 halving event occurred on the 11th of May 2020. The exchange reserve metric jumped higher from the 24th of June to the 31st of July, roughly six weeks after the halving. A month later in August, Bitcoin saw a nearly 20% correction.
If history were to repeat itself, the reserve metric could see a minor bounce in early June, and a similar correction around July. Hence, it is a metric that investors and swing traders might want to keep an eye on.
Source: CryptoQuant
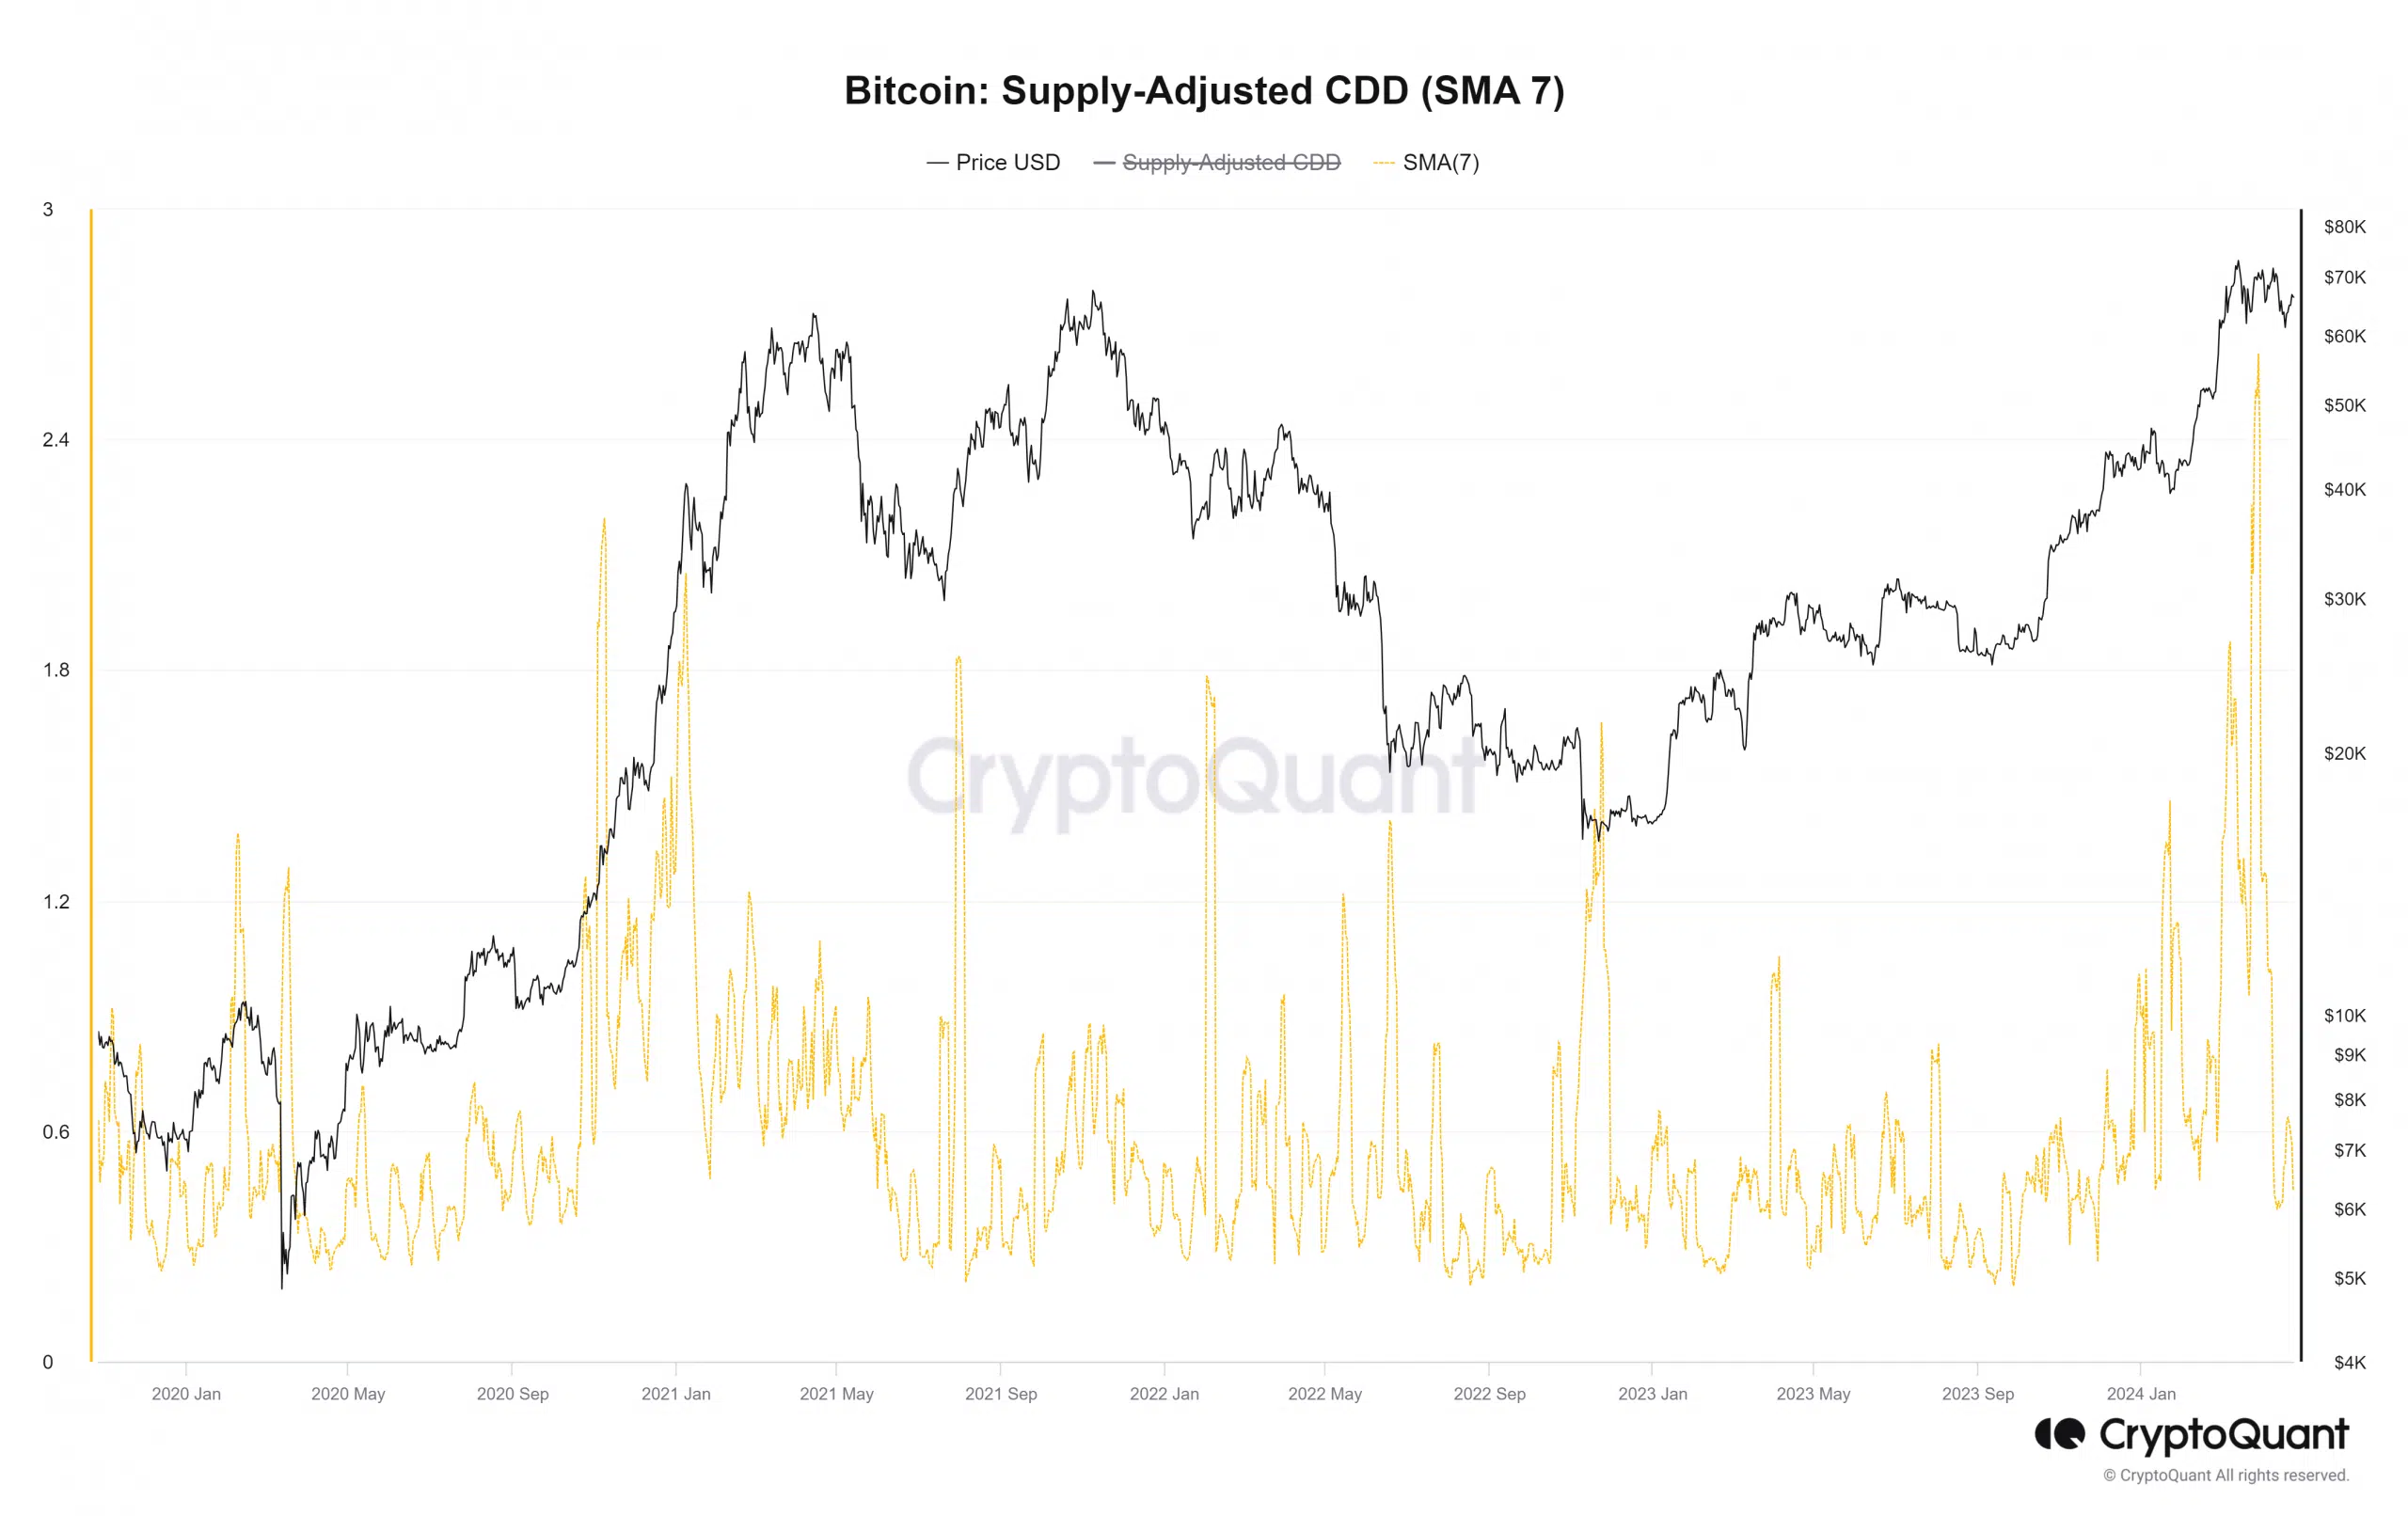
On the other hand, the Bitcoin supply-adjusted Coin Days Destroyed (CDD) reset itself late in March. This metric evaluates the age of the coins being spent in a transaction, with more weightage given to the older coins.
A sharp rise in this metric indicates that long-held coins are being spent in great amounts. In other words, long-term holders (LTHs) are taking profits.
Is your portfolio green? Check the Bitcoin Profit Calculator
This happened recently. The CDD’s 7-day moving average spiked higher than it has in four years. Shortly thereafter, on the 19th of April, the price of Bitcoin reached the $59.6k low.
Since then, BTC has bounced by 11.5% to trade at $66.4k. Even after the long-term holders booked profits, the $60k support zone was defended. Combined with the rising accumulation, there was a chance that the bull run could begin in earnest shortly.