XRP price is moving lower below the $0.5200 support. The price could gain bearish momentum if there is a close below the $0.50 support.
- XRP is showing bearish signs below the $0.525 and $0.512 resistance levels.
- The price is now trading below $0.520 and the 100 simple moving average (4 hours).
- There was a break below a key contracting triangle with support at $0.5220 on the 4-hour chart of the XRP/USD pair (data source from Kraken).
- The pair is now at risk of more downsides below the $0.5000 support zone.
XRP Price Takes Hit
In the past few days, XRP price heavy bearish moves below the $0.550 support. The bears remained active near the $0.5500 resistance and protected a recovery wave, unlike Bitcoin and Ethereum.
There was a fresh decline from the $0.5389 high and the bears pushed the price below $0.5200. There was a steady decline and there was a break below a key contracting triangle with support at $0.5220 on the 4-hour chart of the XRP/USD pair.
The price is now trading below $0.520 and the 100 simple moving average (4 hours). A low is formed near $0.5012, and the price is now consolidating losses. On the upside, immediate resistance is near the $0.520 zone. It is near the 50% Fib retracement level of the downward wave from the $0.5389 swing high to the $0.5012 low.
The first key resistance is near $0.530 or the 76.4% Fib retracement level of the downward wave from the $0.5389 swing high to the $0.5012 low, above which the price could rise toward the $0.5380 resistance.
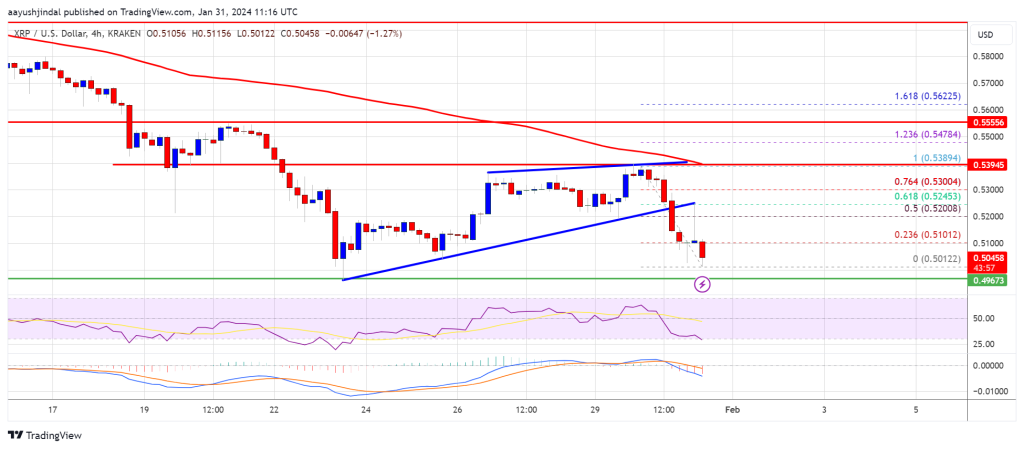
Source: XRPUSD on TradingView.com
A close above the $0.5380 resistance zone could spark a strong increase. The next key resistance is near $0.5550. If the bulls remain in action above the $0.5550 resistance level, there could be a rally toward the $0.5800 resistance. Any more gains might send the price toward the $0.6000 resistance.
Key Downside Break?
If XRP fails to clear the $0.5200 resistance zone, it could continue to move down. Initial support on the downside is near the $0.502 zone.
The next major support is at $0.500. If there is a downside break and a close below the $0.500 level, XRP price might accelerate lower. In the stated case, the price could retest the $0.450 support zone.
Technical Indicators
4-Hours MACD – The MACD for XRP/USD is now gaining pace in the bearish zone.
4-Hours RSI (Relative Strength Index) – The RSI for XRP/USD is now below the 50 level.
Major Support Levels – $0.505, $0.500, and $0.450.
Major Resistance Levels – $0.520, $0.538, and $0.550.
Disclaimer: The article is provided for educational purposes only. It does not represent the opinions of NewsBTC on whether to buy, sell or hold any investments and naturally investing carries risks. You are advised to conduct your own research before making any investment decisions. Use information provided on this website entirely at your own risk.