Most Read: Japanese Yen Forecast – Brighter Days Ahead; Setups on USD/JPY, EUR/JPY, GBP/JPY
Market participants will be on tenterhooks in the coming days ahead of a high-impact item on the U.S. calendar next week: the release of core PCE data – the Fed’s favorite inflation gauge. This crucial event on the agenda is likely to stir volatility within the FX space, so the retail crowd needs to be vigilant and ready for unpredictable price swings.
In terms of consensus estimates, core PCE is projected to have risen by 0.4% in January, bringing the annual rate down to 2.7% from 2.9% previously, a small but welcome step in the right direction. Traders, however, shouldn’t be taken aback if the numbers surprise to the upside, echoing the patterns and trends seen in last week’s CPI and PPI reports for the same period.
Sticky price pressures in the economy, together with solid job creation and hot wage growth, could compel the Fed to delay the start of its easing cycle to the second half of the year, resulting in only modest adjustments once the process gets underway. Such a scenario could push interest rate expectations in a more hawkish direction compared to their current status.
Higher interest rates for longer could mean upward pressure on U.S. Treasury yields over the coming weeks – an outcome poised to benefit the U.S. dollar and reinforce its bullish momentum seen in 2024. With the greenback biased to the upside, pairs such as EUR/USD and GBP/USD will face difficulties in maintaining positive performance in the short term. Gold prices could also struggle.
Fundamentals aside now, the subsequent section of this article will revolve around examining the technical outlook for EUR/USD, GBP/USD and gold prices. Here, we’ll explore critical price thresholds that traders need to keep on their radar to prepare potential strategies in the upcoming sessions.
Curious about what lies ahead for the euro? Explore all the insights in our Q1 trading forecast. Request your free copy now!
Recommended by Diego Colman
Get Your Free EUR Forecast
EUR/USD TECHNICAL ANALYSIS
EUR/USD has regained lost ground this week, but has yet to fully recover its 200-day simple moving average, currently at 1.0830. Traders should keep a close eye on this indicator in the coming days, bearing in mind that a push above it could give way to a rally towards 1.0890 and possibly even 1.0950.
On the flip side, if prices get rejected to the downside from current levels and begin a rapid descent, technical support emerges at 1.0725. followed by 1.0700. From this point onwards, additional weakness may prompt market focus to shift towards 1.0650.
EUR/USD TECHNICAL ANALYSIS CHART
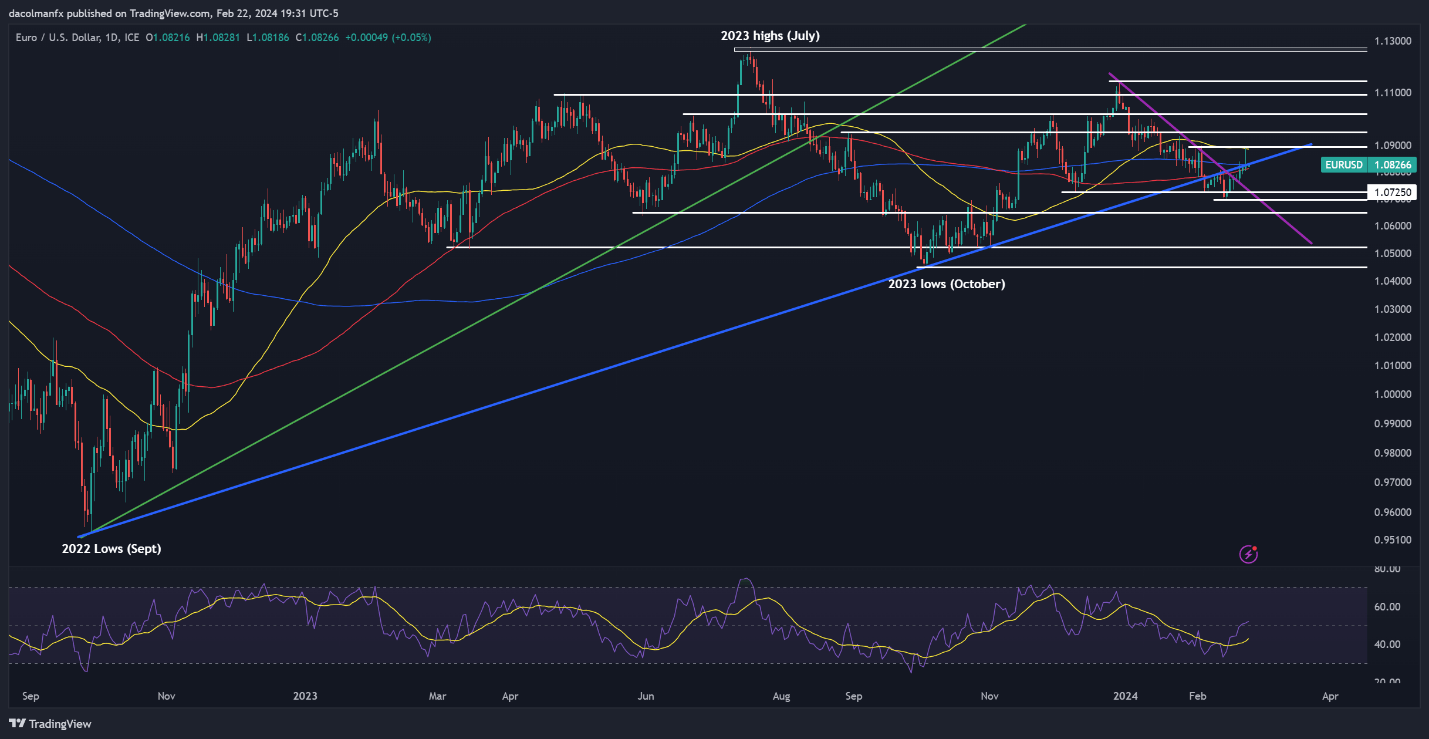
EUR/USD Chart Created Using TradingView
Keen to understand how FX retail positioning can provide hints about the short-term direction of GBP/USD? Our sentiment guide holds valuable insights on this topic. Download it today!
| Change in | Longs | Shorts | OI |
| Daily | -12% | 12% | 1% |
| Weekly | -15% | 14% | 0% |
GBP/USD TECHNICAL ANALYSIS
GBP/USD consolidated to the upside on Thursday, but fell short of clearing its 50-day simple moving average at 1.2680. Bulls may find it challenging to surpass this technical hurdle; however, a breakout could result in a move toward trendline resistance at 1.2725.
Conversely, if sellers stage a comeback and trigger a market reversal, the first line of defense against a bearish attack lies around the 1.2600 mark. Additional losses beyond this point may create the right conditions for a slide toward trendline support and the 200-day simple moving average at 1.2560.
GBP/USD TECHNICAL CHART
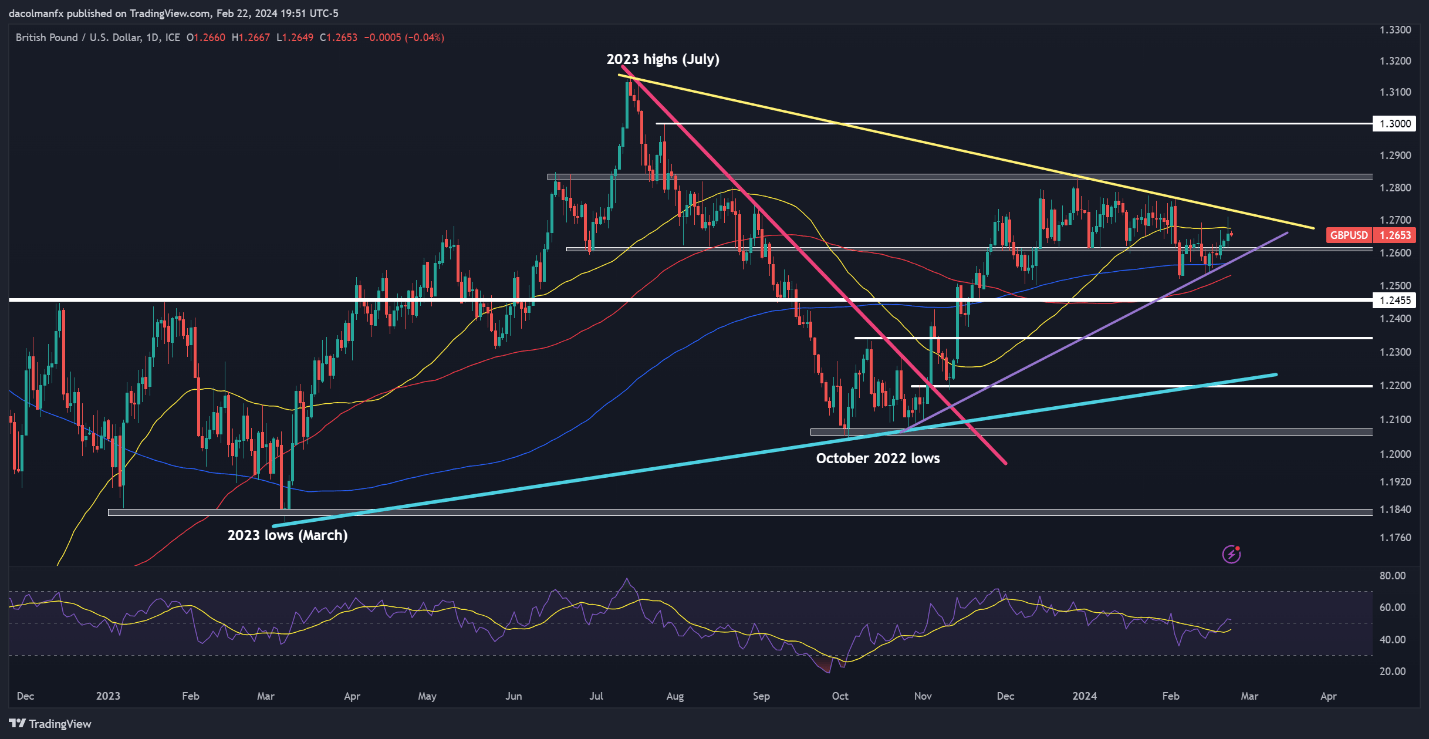
GBP/USD Chart Created Using TradingView
Wondering how retail positioning can shape gold prices in the near term? Our sentiment guide provides the answers you are looking for—don’t miss out, get the guide now!
| Change in | Longs | Shorts | OI |
| Daily | -13% | 10% | -4% |
| Weekly | -17% | 24% | -3% |
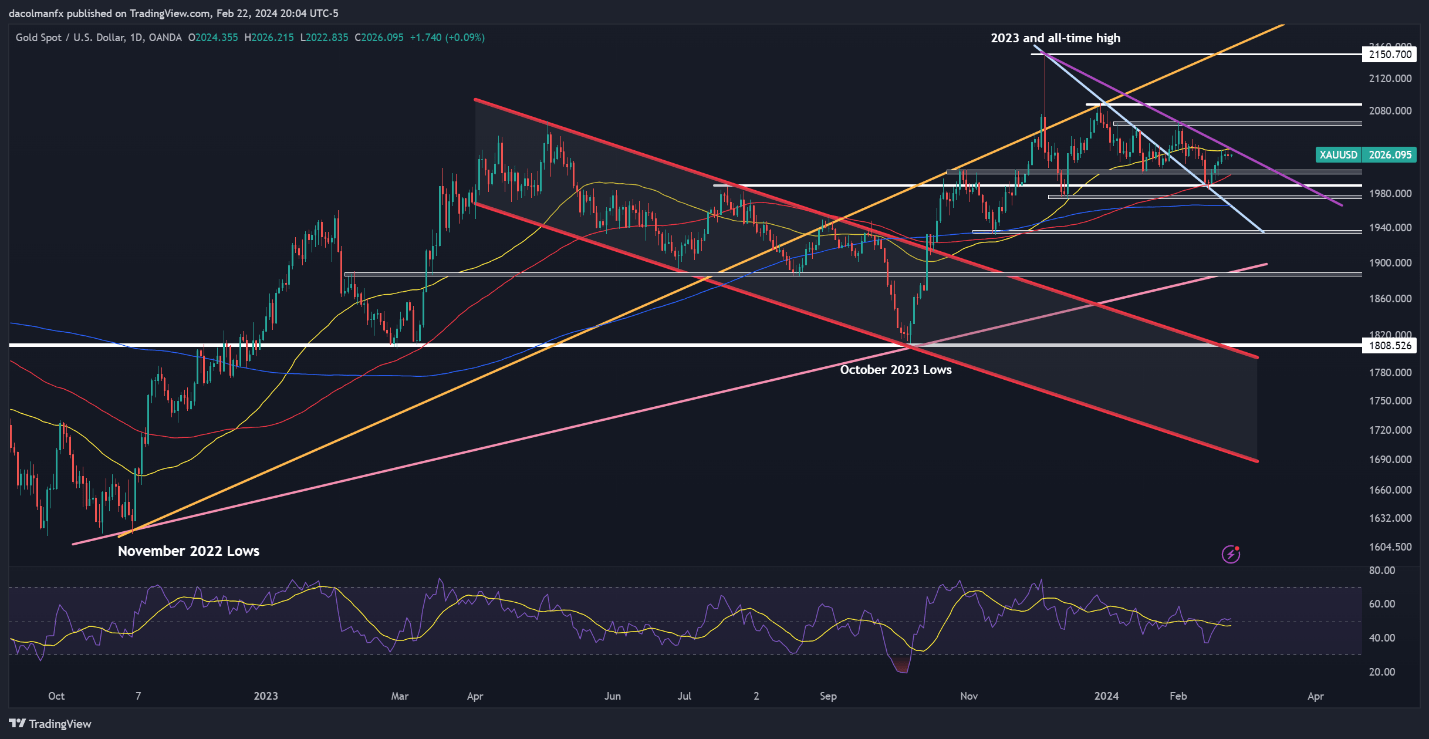
GOLD PRICE TECHNICAL ANALYSIS
Gold rose modestly on Thursday but hit a roadblock around $2,030, a key resistance zone where a downtrend line aligns with the 50-day simple moving average. Sellers need to defend this area vigorously to prevent bulls from reasserting dominance; failure to do so could result in a rally toward $2,065.
On the other hand, if sentiment reverses in favor of sellers and prices begin to retreat, support can be identified at $2,005, positioned near the 100-day simple moving average. Further downside pressure may then bring $1,990 into focus, followed by $1,995.
GOLD PRICE (XAU/USD) TECHNICAL CHART