US DOLLAR OUTLOOK – EUR/USD, GBP/USD, USD/JPY
- The U.S. dollar retreated sharply this past week, pressured by falling U.S. Treasury yields
- However, the tide may turn in the greenback’s favor if upcoming U.S. CPI data tops estimates
- February’s U.S. inflation numbers will be released on Tuesday morning
Most Read: USD/JPY Sinks on Bets BoJ Will End Negative Rates Soon, US Inflation in Focus
The U.S. dollar fell sharply last week, pressured by falling U.S. Treasury yields on growing expectations that the Federal Reserve may soon begin to reduce borrowing costs for the US economy. By the end of the week after all the twists and turns, the DXY index had plummeted by 1.10%, marking its worst weekly performance since early December.
US DOLLAR INDEX VS US BOND YIELDS
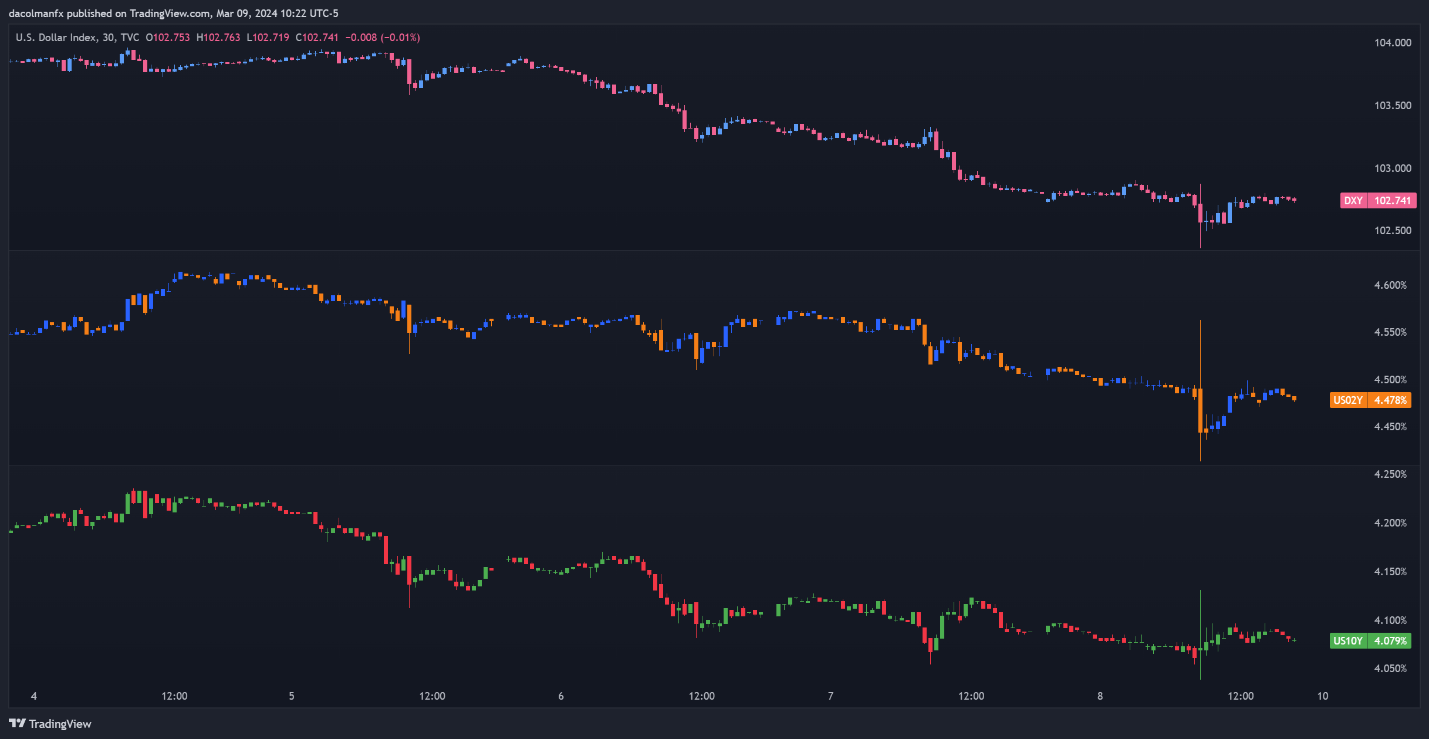
Source: TradingView
Although Fed Chairman Powell indicated that the central bank is not yet sufficiently assured that consumer prices are on a sustained path toward convergence to the 2.0% target to slash interest rates imminently, he also suggested that policymakers are “not far” from gaining greater confidence in the inflation outlook to finally pull the trigger.
Eager to discover what the future may have in store for the U.S. dollar? Find comprehensive answers in our quarterly forecast! Get it today!
Recommended by Diego Colman
Get Your Free USD Forecast
Powell’s remarks to Congress, coupled with mixed U.S. employment figures that revealed an unexpected uptick in the jobless rate to 3.9% in February, bolstered bets that the Fed could deliver its first cut of the cycle in June, raising the odds of this event to 57% on Friday from 52% two days earlier. The chart below shows current Fed meeting probabilities.
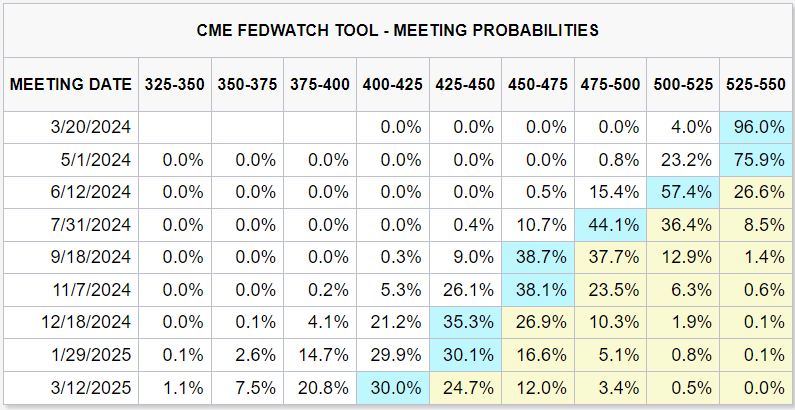
Source: CME Group
Looking ahead, while U.S. dollar bears have regained the upper hand, the tables could turn in the coming days. For example, if February’s US inflation data, to be released on Tuesday, beats consensus estimates by a wide margin, mirroring January’s upside surprise, the mood could change at the drop of a hat, allowing bulls to mount a comeback.
The following table provides an overview of Wall Street CPI forecasts as of Friday.
UPCOMING US INFLATION REPORT
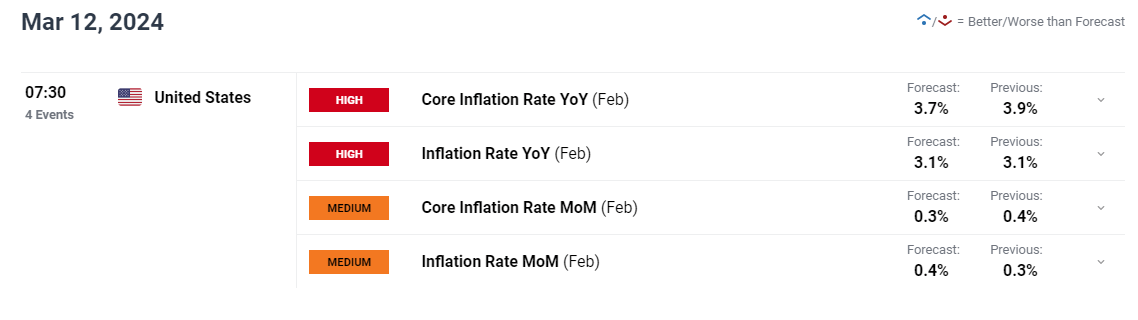
Source: DailyFX Economic Calendar
CPI numbers indicating minimal progress on disinflation should be bullish for the U.S. dollar, as it could spark a hawkish repricing of the Fed’s roadmap. This is because, in such a scenario, investors would expect the Fed to keep interest rates higher for longer, which would mean a delay in monetary policy easing.
Meanwhile, a subdued inflation report below consensus estimates should be bearish for the greenback. This would validate Wall Street’s dovish outlook, leading to an extension of the recent pullback in yields. Given the potential market impact of the upcoming consumer price index survey, traders should follow its release closely, paying particular attention to the trend in core metrics.
Want to know where EUR/USD is headed over the coming months? Explore all the insights available in our quarterly forecast. Request your complimentary guide today!
Recommended by Diego Colman
Get Your Free EUR Forecast
EUR/USD FORECAST – TECHNICAL ANALYSIS
EUR/USD has rallied sharply in recent days, pushing past several important thresholds during the upswing. If gains pick up traction over the coming week, a key ceiling to monitor emerges at 1.0980, followed by 1.1020. Subsequent strength would then shift focus to trendline resistance at 1.1075.
Conversely, if sellers unexpectedly stage a comeback and drive prices lower, the first technical floor to keep an eye on is located at 1.0890. In the event of further losses beyond this point, the spotlight will be on confluence support at 1.0850 and 1.0790 thereafter.
EUR/USD PRICE ACTION CHART
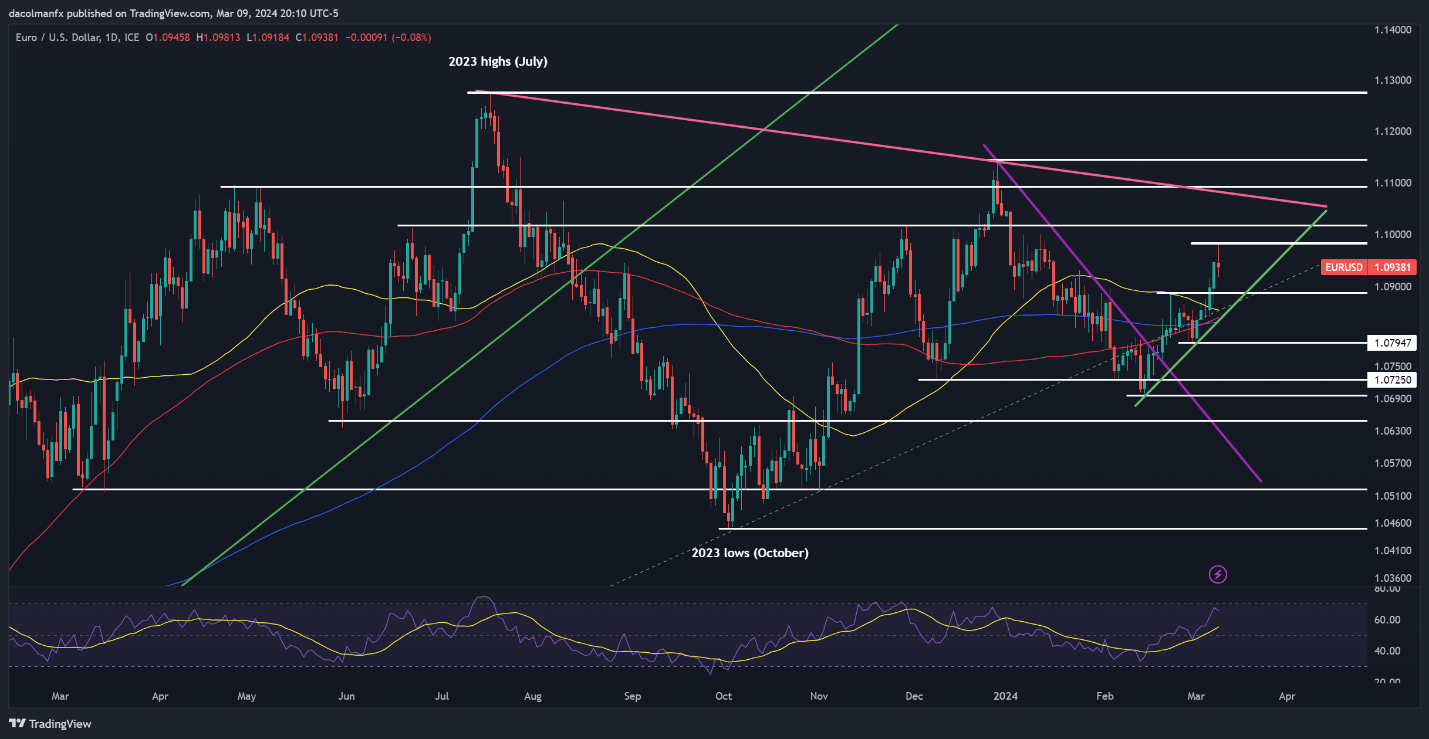
EUR/USD Chart Created Using TradingView
Curious about what lies ahead for the Japanese yen? Find comprehensive answers in our quarterly outlook. Claim your free copy now!
Recommended by Diego Colman
Get Your Free JPY Forecast
USD/JPY FORECAST – TECHNICAL ANALYSIS
USD/JPY plummeted this week, slipping below 147.50 and closing at its lowest point since early February. If losses continue over the coming trading sessions, initial support appears at 146.50. Below this level, attention will be on the 200-day simple moving average slightly above the 146.00 mark.
On the other hand, if U.S. dollar bulls manage to trigger a rebound, resistance is anticipated around 147.50. Beyond that threshold, all eyes will be on 148.90. Looking higher, a further move to the upside could see market interest shift towards 149.70, followed by 150.90.
USD/JPY PRICE ACTION CHART
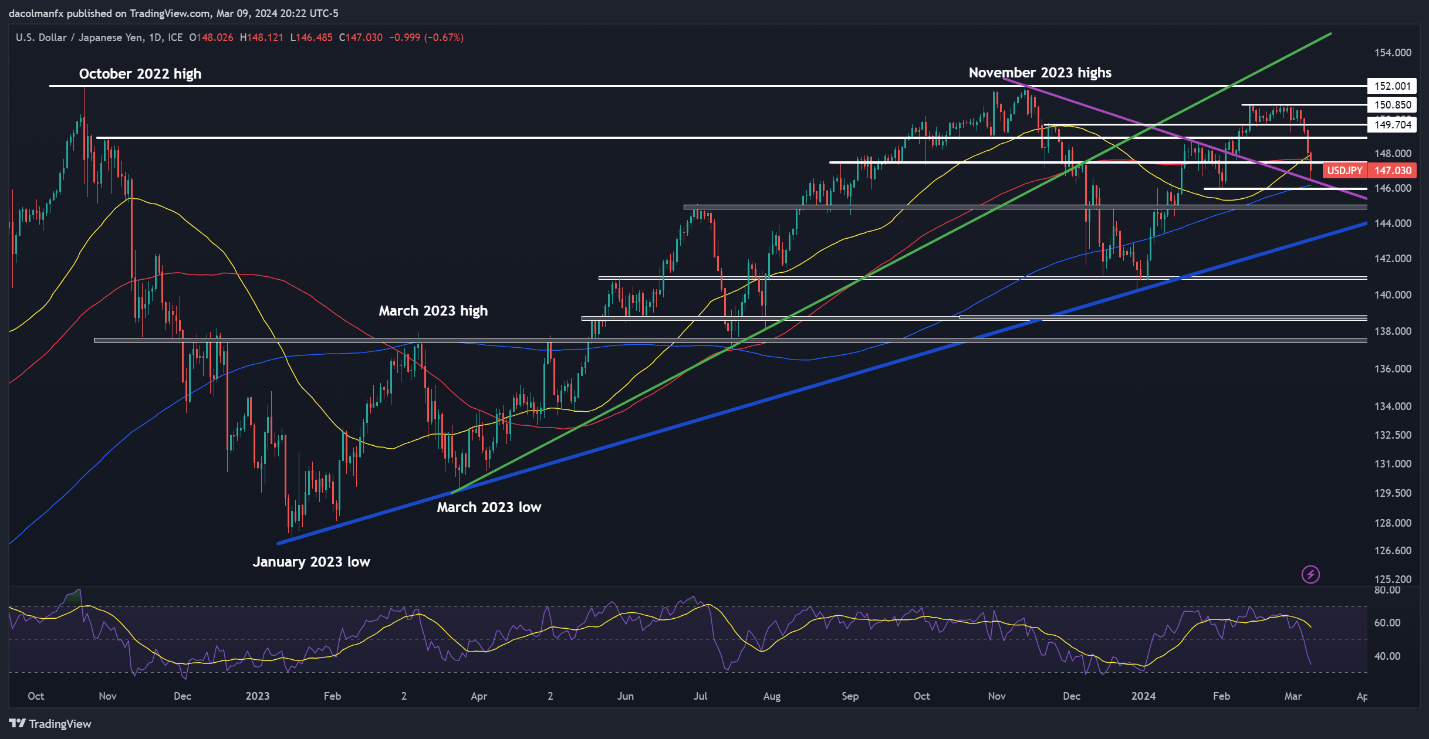
USD/JPY Chart Created Using TradingView
Interested in learning how retail positioning can offer clues about GBP/USD’s directional bias? Our sentiment guide contains valuable insights into market psychology as a trend indicator. Download it now!
| Change in | Longs | Shorts | OI |
| Daily | -7% | 3% | -1% |
| Weekly | -25% | 42% | 11% |
GBP/USD FORECAST – TECHNICAL ANALYSIS
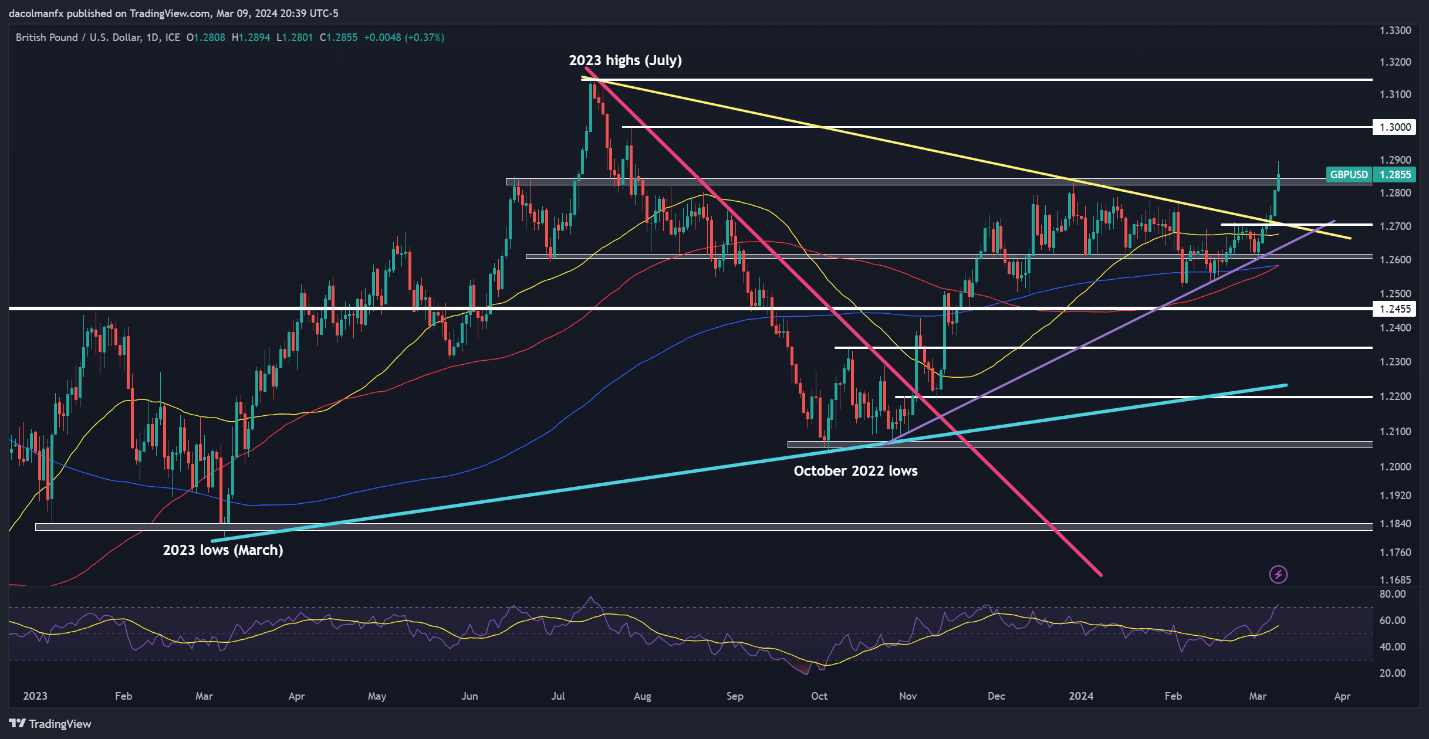
GBP/USD soared this week, clearing a major resistance near 1.2830 just before the weekend. If this bullish breakout is sustained in the days ahead, buyers may feel emboldened to initiate an attack on the psychological 1.3000 level. Above this point, additional gains will bring 1.3140 into view.
On the flip side, if sentiment turns bearish all of a sudden and prices start moving downwards, support lies at 1.2830, followed by 1.2715. Moving lower, attention will be on the 50-day simple moving average hovering around 1.2675.
GBP/USD PRICE ACTION CHART