Most Read: US Dollar Forecast – US PCE to Guide Markets; EUR/USD, GBP/USD, USD/JPY Setups
The U.S. dollar, as measured by the DXY index, was subdued, and displayed restraint on Monday despite a modest uptick in U.S. Treasury yields. Market participants appear to be leaning toward a cautious stance at the start of the new week ahead of a high-impact event on Thursday: the release of the core personal consumption expenditures deflator, the Federal Reserve’s preferred inflation gauge.
January’s core PCE is seen rising 0.4% compared to December, resulting in a marginal drop in the yearly rate from 2.9% to 2.8% – a small but constructive move forward. However, traders should be prepared for the possibility of official results topping forecasts, echoing the trends and patterns observed in the CPI and PPI reports unveiled earlier this month.
UPCOMING US PCE REPORT
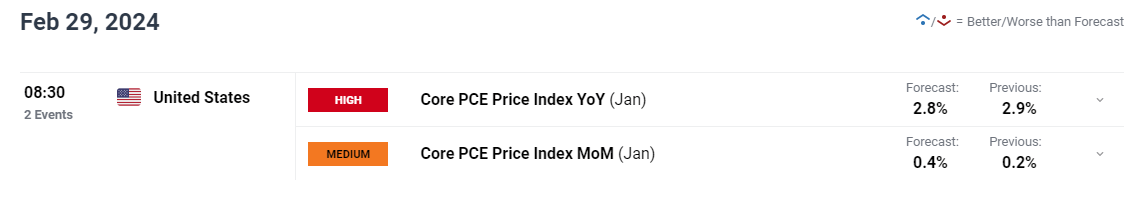
Source: DailyFX Economic Calendar
In the event of an upside surprise in the data, we could see interest rate expectations drift upwards on wagers that policymakers will delay the start of the easing cycle and deliver only small cuts once the process gets underway. This scenario is likely to keep U.S. Treasury yields biased higher, creating a favorable environment for the greenback.
Leaving fundamental analysis behind now, the next part of this article will focus on examining the technical outlook for three major U.S. dollar pairs: EUR/USD, USD/CAD and USD/JPY. In this section, we’ll assess market sentiment and identify essential price levels that could act as support or resistance in the upcoming trading sessions.
Eager to gain clarity on the euro‘s future trajectory? Access our quarterly trading forecast for expert insights. Secure your free copy now!
Recommended by Diego Colman
Get Your Free EUR Forecast
EUR/USD FORECAST – TECHNICAL ANALYSIS
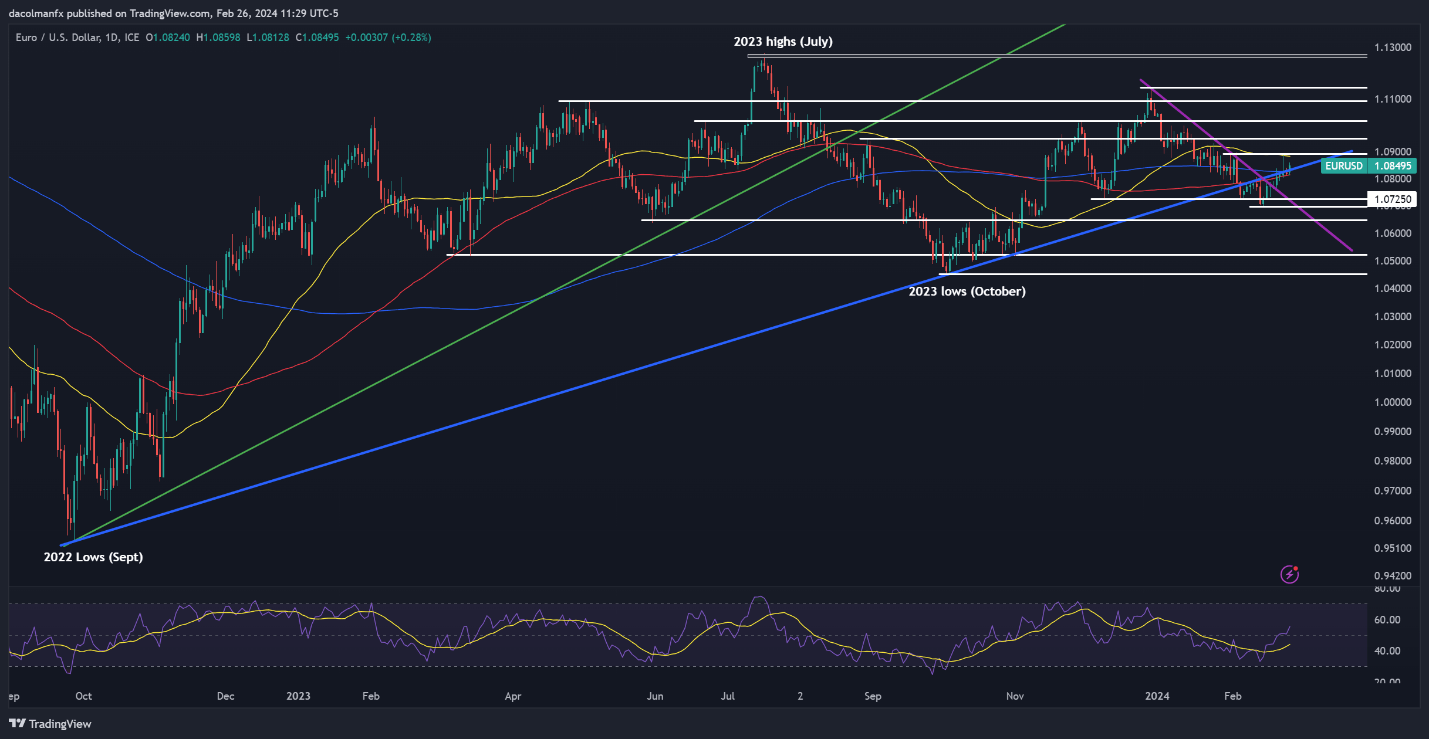
EUR/USD rose on Monday, pushing past its 200-day simple moving average at 1.0835 – a positive technical development for the common currency. If the breakout is sustained in the coming days, buyers could be emboldened to initiate an attack on 1.0890. On continued strength, all eyes will be on 1.0950.
On the other hand, if sentiment reverses in favor of sellers and prices fall below the 200-day SMA decisively, key support levels are anticipated at 1.0725, succeeded by 1.0700. Moving further to the downside, attention will turn to 1.0650.
EUR/USD PRICE ACTION CHART
EUR/USD Chart Created Using TradingView
Interested in understanding how FX retail positioning may influence USD/CAD price movements? Discover key insights in our sentiment guide. Download it now!
| Change in | Longs | Shorts | OI |
| Daily | 11% | 2% | 7% |
| Weekly | -13% | 19% | -1% |
USD/CAD FORECAST – TECHNICAL ANALYSIS
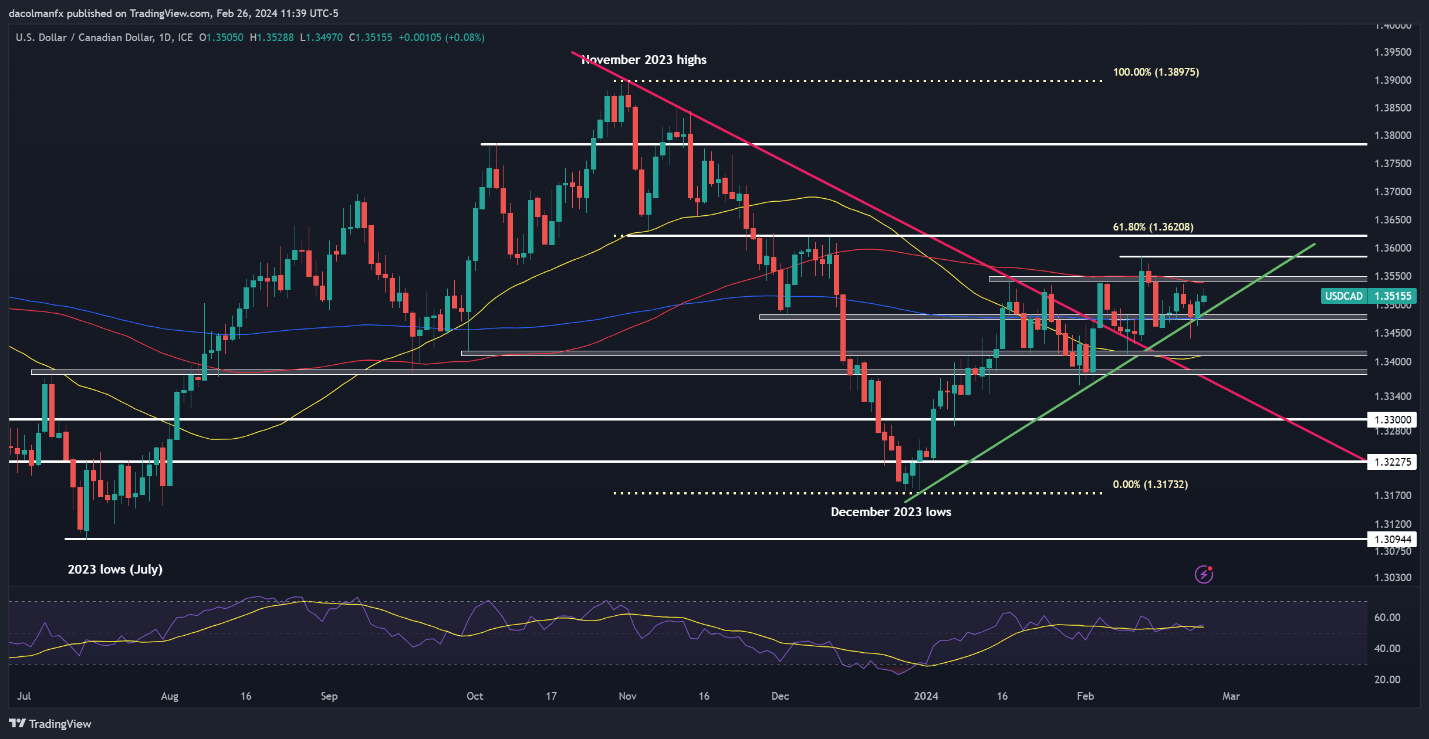
USD/CAD ticked up on Monday after bouncing off trendline support and its 200-day simple moving average late last week. If upward momentum gains traction in the coming days, initial resistance appears at 1.3540, followed by 1.3585. Upside progress beyond these levels will draw attention to 1.3620.
Alternatively, if prices pivot downwards, support stretches from 1.3485 to 1.3475. While this region may provide stability for the pair during a pullback, a breakdown could lead to a swift descent toward the 50-day simple moving average at 1.3415.
USD/CAD PRICE ACTION CHART
USD/CAD Chart Created Using TradingView
Want to stay ahead of the yen‘s next big move? Delve into our quarterly forecast for comprehensive insights. Request your complimentary guide now to keep abreast of market trends!
Recommended by Diego Colman
Get Your Free JPY Forecast
USD/JPY FORECAST – TECHNICAL ANALYSIS
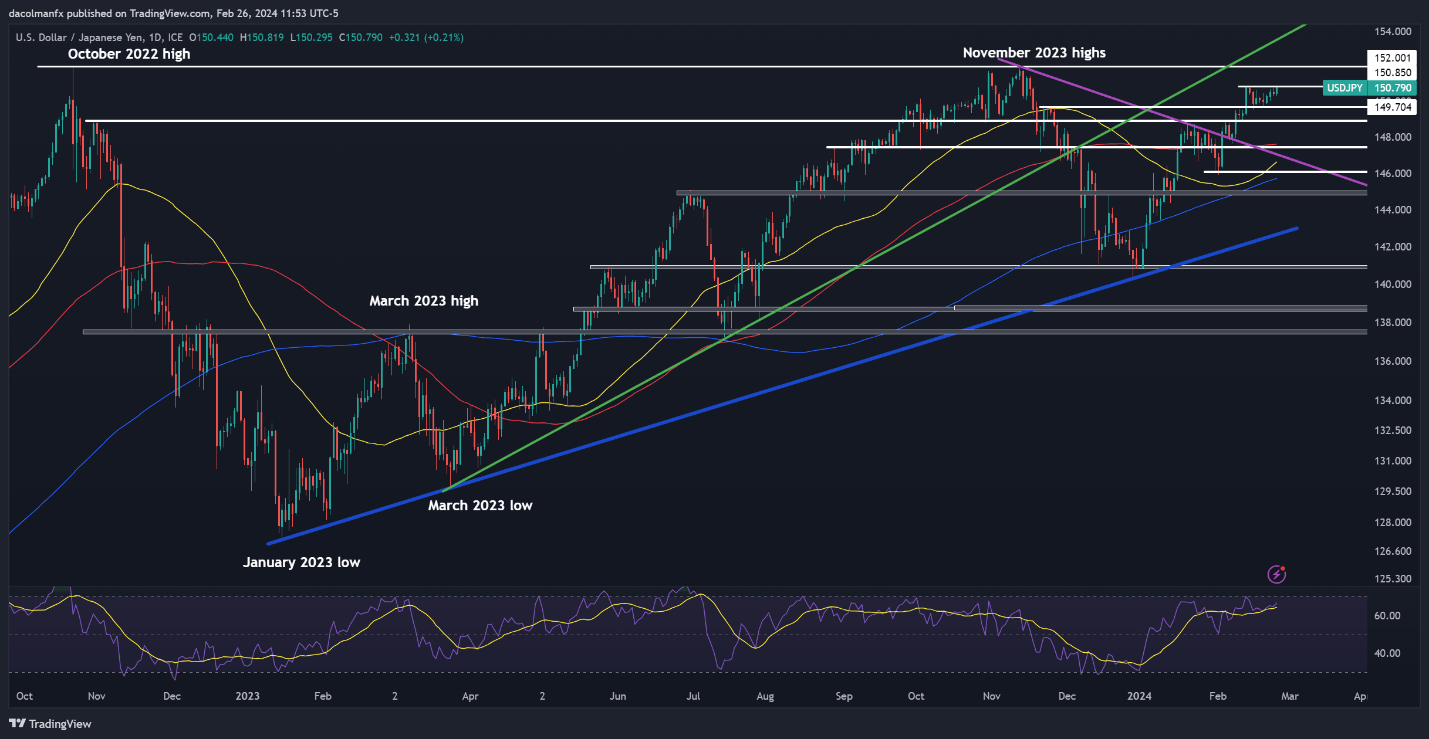
USD/JPY edged higher on Monday, coming within striking distance from taking out a critical resistance at 150.85. Traders need to keep a close eye on this technical ceiling this week, as a clean and clear breakout could spark buying momentum and set the stage for a retest of the 152.00 handle.
Conversely, if sellers unexpectedly gain control of the steering wheel and initiate a bearish swing, support can be spotted at 149.70 and 148.90 thereafter. Sustained losses beneath these important price thresholds could result in a retreat towards the 100-day simple moving average slightly above 147.50.
USD/JPY TECHNICAL CHART