
Tron price is eyeing a fresh increase from the $0.1112 support against the US Dollar. TRX is outperforming Bitcoin and could rise further above $0.1140.
- Tron is moving higher above the $0.1120 resistance level against the US dollar.
- The price is trading above $0.1125 and the 100 simple moving average (4 hours).
- There was a break above a key contracting triangle with resistance at $0.1126 on the 4-hour chart of the TRX/USD pair (data source from Kraken).
- The pair could continue to climb higher toward $0.1165 or even $0.1200.
Tron Price Restarts Increase
Recently, Bitcoin and Ethereum saw a major rejection. However, Tron price remained stable above the $0.1100 support. Earlier, there was a steady increase toward the $0.1165 level before TRX started a downside correction.
There was a move below the $0.1150 level. The price declined below the 23.6% Fib retracement level of the upward move from the $0.1059 swing low to the $0.1165 high. The bulls are now protecting the $0.1125 support zone and the 100 simple moving average (4 hours).
Tron is now moving higher and trading above $0.1120. There was a break above a key contracting triangle with resistance at $0.1126 on the 4-hour chart of the TRX/USD pair.
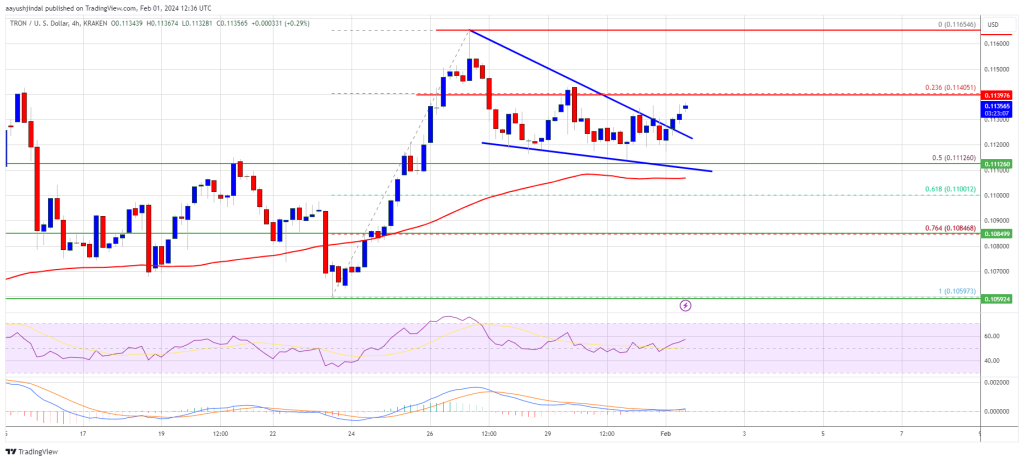
Source: TRXUSD on TradingView.com
On the upside, an initial resistance is near the $0.1140 level. The first major resistance is near $0.1150, above which the price could accelerate higher. The next resistance is near $0.1165. A close above the $0.1165 resistance might send TRX further higher toward $0.1200. The next major resistance is near the $0.1125 level, above which the bulls are likely to aim for a larger increase toward $0.1300.
Are Dips Supported in TRX?
If TRX price fails to clear the $0.1140 resistance, it could start a downside correction. Initial support on the downside is near the $0.1120 zone.
The first major support is near the $0.1100 level or the 50% Fib retracement level of the upward move from the $0.1059 swing low to the $0.1165 high, below which it could test $0.1085. Any more losses might send Tron toward the $0.1050 support in the coming sessions.
Technical Indicators
4 hours MACD – The MACD for TRX/USD is gaining momentum in the bullish zone.
4 hours RSI (Relative Strength Index) – The RSI for TRX/USD is currently above the 50 level.
Major Support Levels – $0.1100, $0.1085, and $0.1050.
Major Resistance Levels – $0.1140, $0.1165, and $0.1200.
Disclaimer: The article is provided for educational purposes only. It does not represent the opinions of NewsBTC on whether to buy, sell or hold any investments and naturally investing carries risks. You are advised to conduct your own research before making any investment decisions. Use information provided on this website entirely at your own risk.