
Gold, Silver Weekly Forecast: Bearish
- Gold pulled back sharply after testing trendline resistance – tempered rate cut expectations support USD, weigh on gold
- Gold loses its lustre ahead of Q4 GDP and PCE data
- Silver downtrend intact as the metal approaches key support
- Download our fresh off the shelves gold forecast for Q1 2024:
Recommended by Richard Snow
Get Your Free Gold Forecast
Tempered Rate Cut Expectations Support USD, Weigh on Gold
Prominent Fed members utilised their remaining days ahead of the media blackout to warn markets about overly optimistic rate cut expectations. Officials continue to drive home the point that the fight against inflation is not done, and you would have to look no further than the December inflation print to come to that realization. Admittedly, the headline and core measures of inflation don’t tell the full story as base effects are expected to send upcoming CPI prints lower and lower in the absence of any external shocks or major supply disruptions in the Red Sea.
Markets tapered expectations of aggressive interest rate cuts for 2024 which helped to bolster the US dollar and so the US treasury yields halt the recent decline. A stronger U.S. dollar renders gold more expensive for foreign purchasers of the foreign metal. In addition, US 2 and 10-year treasury yields rose, rendering gold (a non interest bearing asset) less attractive.
Towards the latter stages of last week it appeared as if gold had picked up a slight safe haven bid off the news of attempted Houthi strikes on shipments with an association with to the west. However, when looking at the impressive rise in U.S. equity indices, it would be difficult to suggest there is a risk of mood in the market right now.
Gold Loses its Lustre Ahead of Q4 GDP and PCE Data
The weekly chart reveals a close lower although the weekly low nearly tested the $2,000 psychological level during a week of ups and downs. With a weekly close above the $2,010 level, the precious metal still holds out for a potential bullish reversal, however, bullish drivers appear scarce outside of the elevated geopolitical tension in the Middle East. Therefore, not only is the $2,010 level of interest next week but the $2,000 level it becomes a possibility too.
Gold Weekly Chart
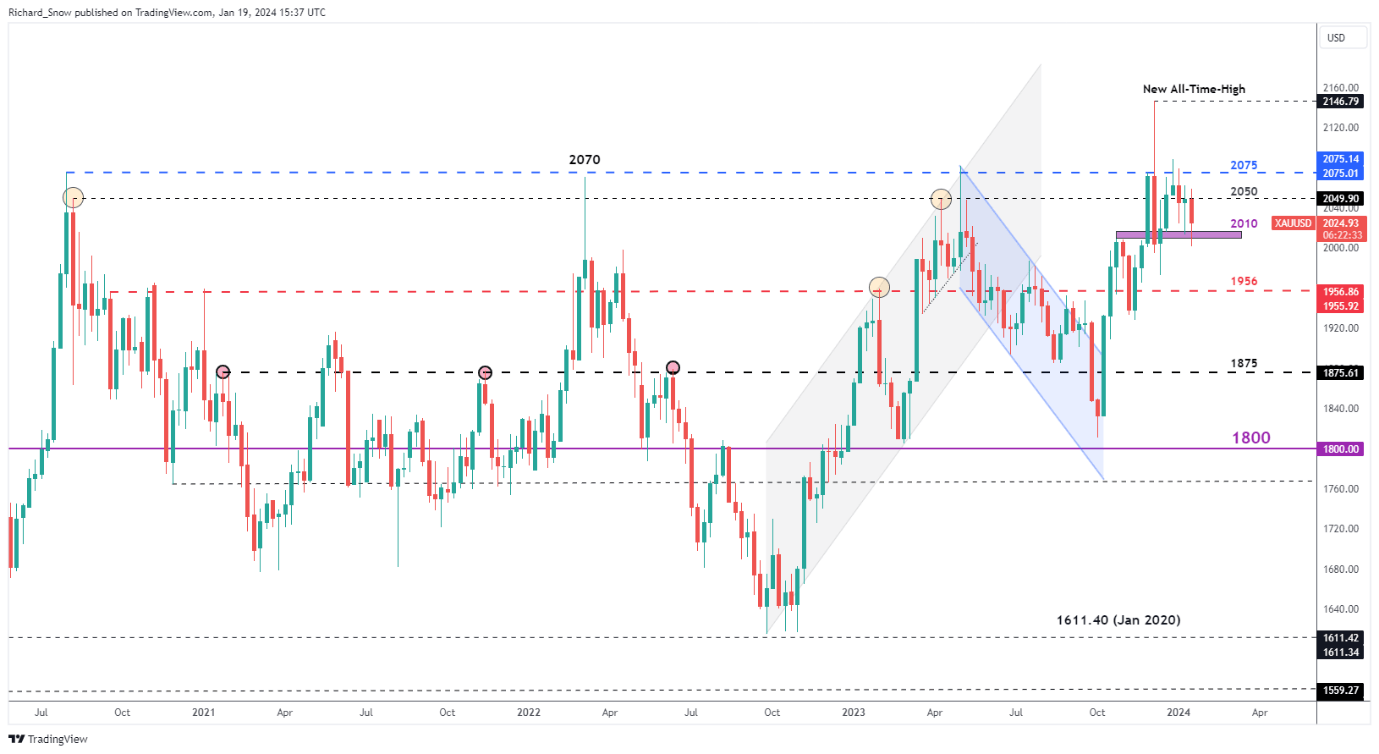
Source: TradingView, prepared by Richard Snow
Recommended by Richard Snow
How to Trade Gold
Looking at the daily chart for levels of interest heading into the new week, if bears rarely get hold of this recent change in sentiment and push prices even further, we could even see another test of the $1,985 level – which coincides with the underside of the medium-term bearish channel.
Of course, it would be irresponsible not to consider the potential for a retest of channel resistance and even the $2,050 level. Although, it would appear as if there is a rather high bar for bullish price action which may rely on increasing tensions in the Middle East or a much softer than expected US core PCE and/or fourth quarter GDP data.
Gold Daily Chart
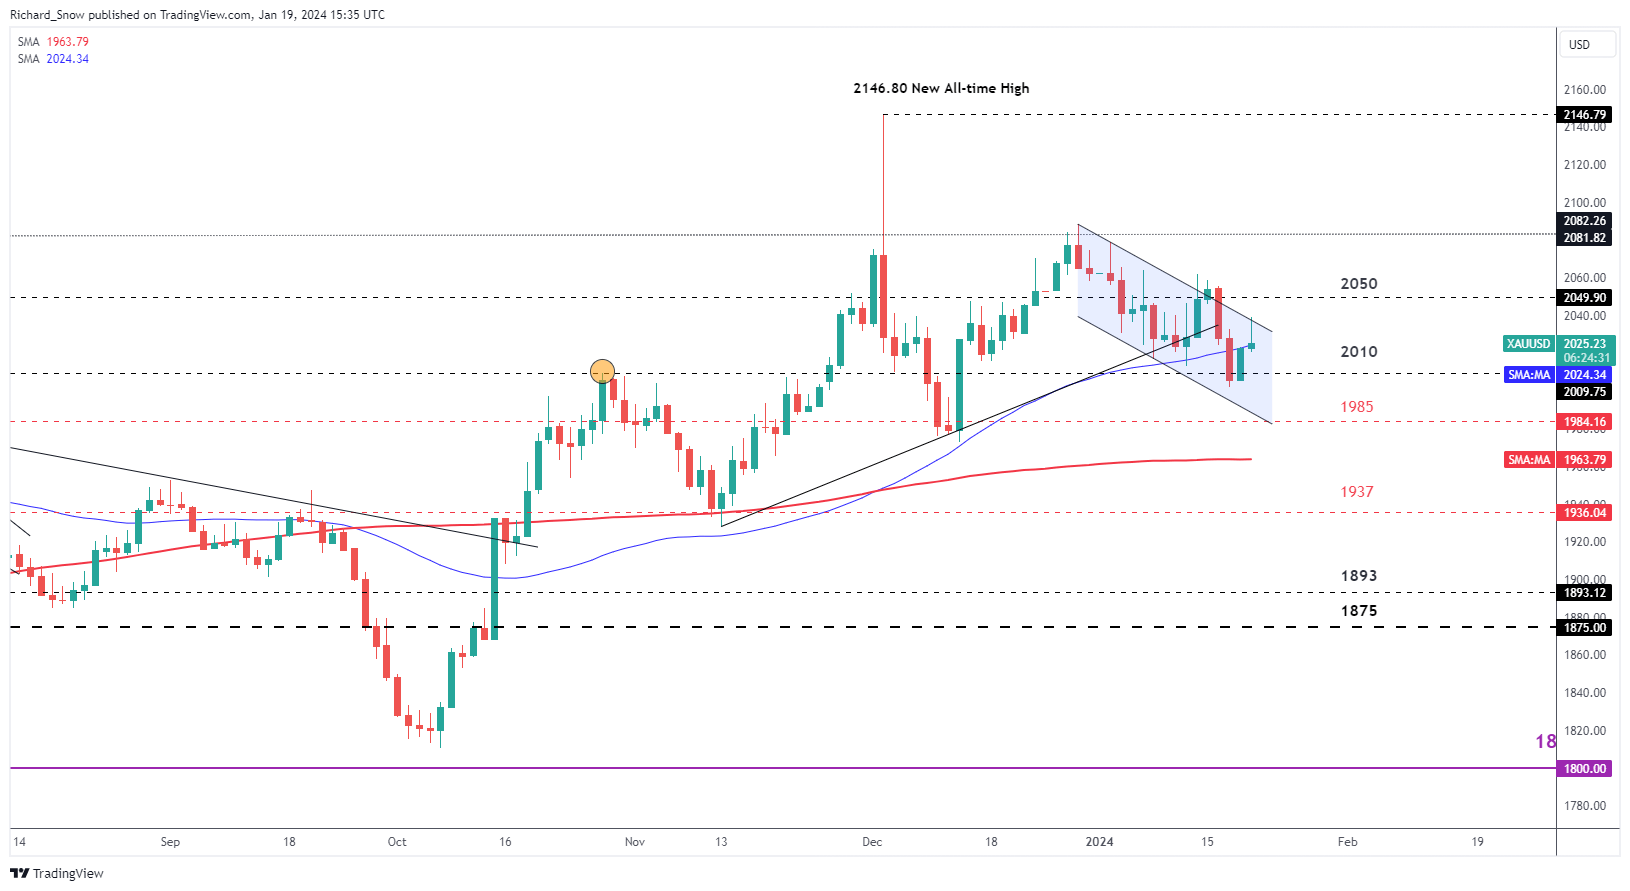
Source: TradingView, prepared by Richard Snow
Silver Downtrend Intact as the Metal Approaches Key Support
The weekly chart reveals fairly choppy price action in silver since the middle of last year with the occasional spike outside of the typical range that has encapsulated the majority of price action since then ($22.36 – $25.00).
As the week came to a close, the 38.2% Fibonacci retracement of the major 2021 to 2022 decline provides a significant level of support that has come into play not only in the latter stages of 2021 but it’s also supported silver prices since the middle of last year. In the event bears take control, a move towards $21.43 remains possible and the more extreme scenario could see price action dropping as low as $20.52 (the 23.6% Fibonacci retracement).
Silver Weekly Chart
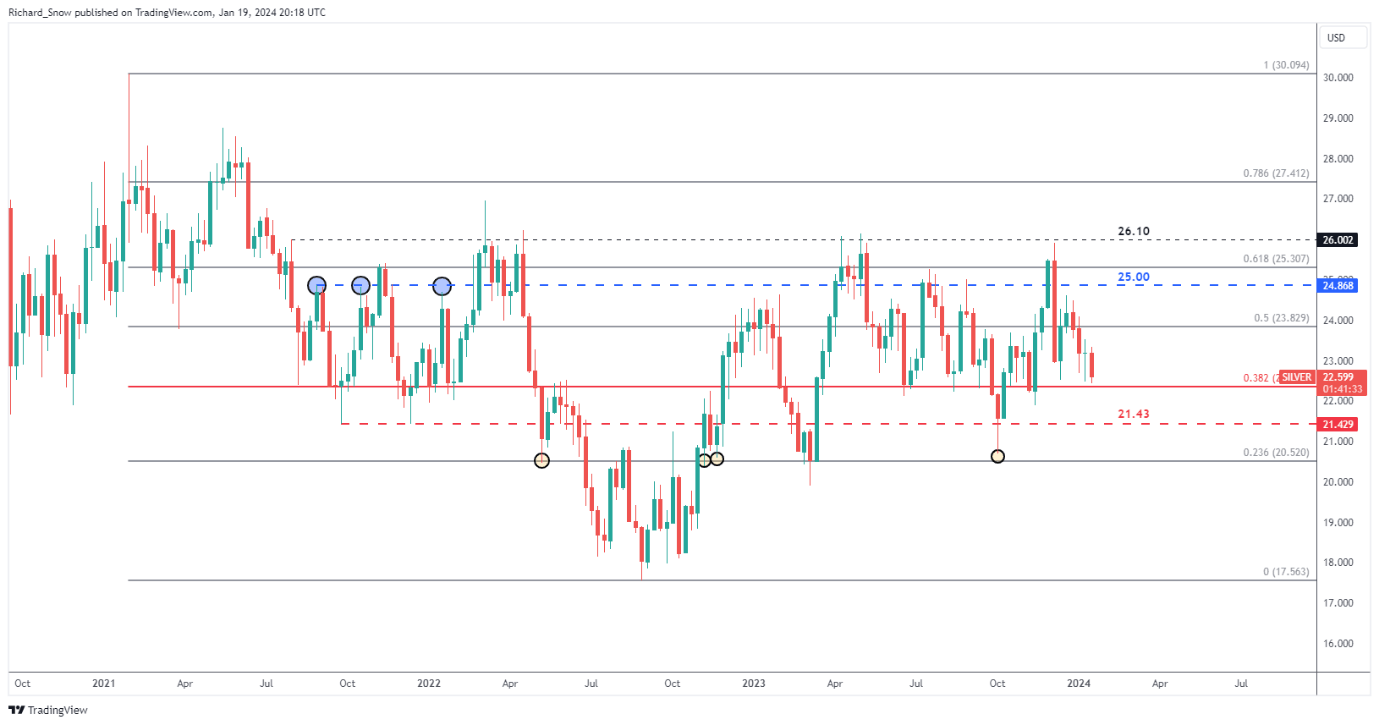
Source: TradingView, prepared by Richard Snow
The daily chart for silver has been rather tricky in the last couple of weeks as the appearance of a bearish Pennant appeared to show progress to the downside before reversing sharply to find resistance at the 200-day simple moving average (SMA).
After the emergence of a evening star pattern prices did actually move lower where they ended the week a little above the prior mentioned, significant level of support.
Silver Daily Chart
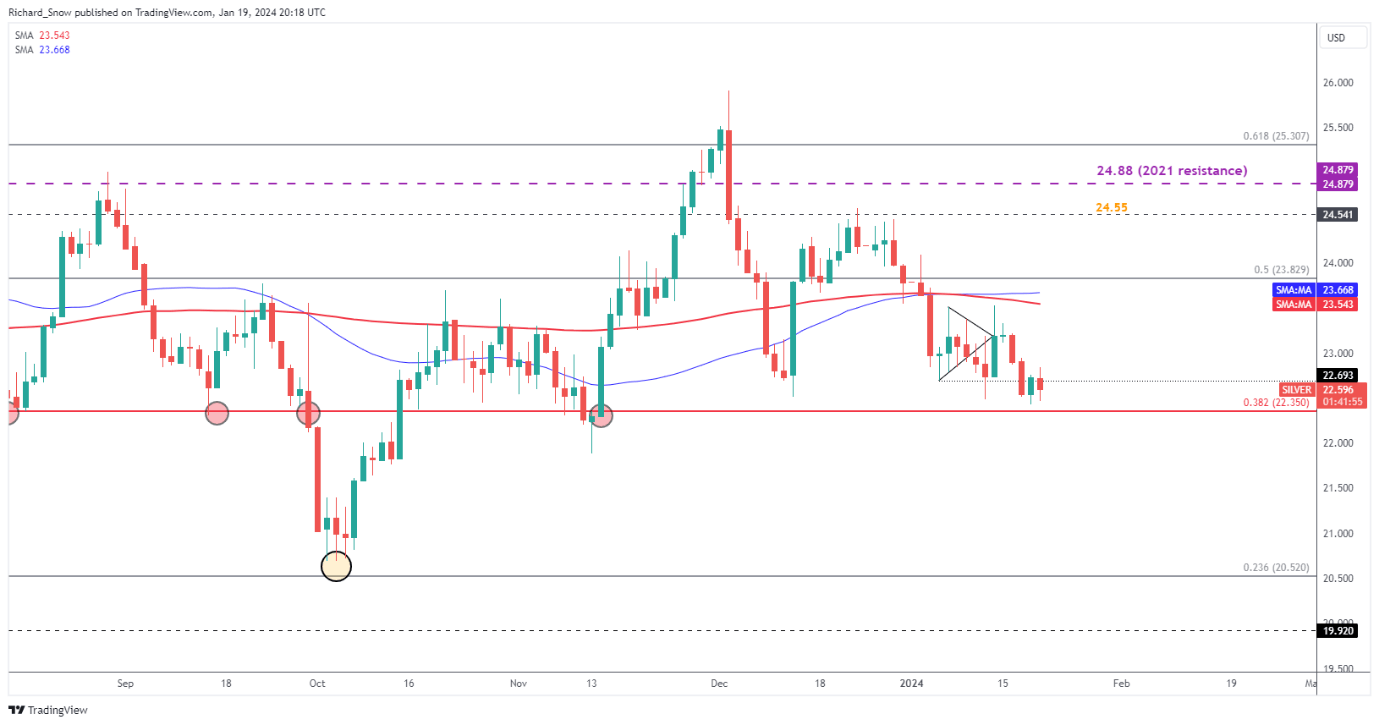
Source: TradingView, prepared by Richard Snow
Recommended by Richard Snow
Recommended by Richard Snow
How To Trade Commodities
— Written by Richard Snow for DailyFX.com
Contact and follow Richard on Twitter: @RichardSnowFX