Nikkei 225, FTSE 100, Nasdaq 100 Prices and Charts
Recommended by Axel Rudolph
Traits of Successful Traders
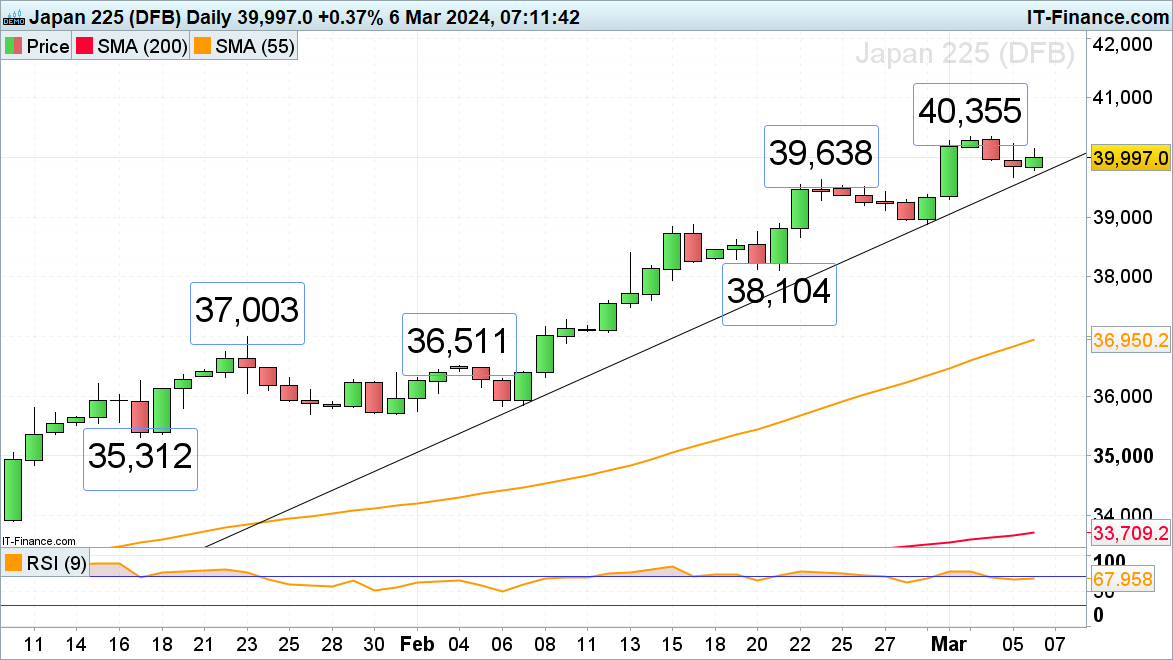
The Nikkei 225 consolidates below the 40,000 mark
The Nikkei 225 rally is taking a breather below last week’s record high and is seen consolidating below the psychological 40,000 mark whilst sliding towards the February-to-March uptrend line at 39,680 which is expected to offer support together with Tuesday’s 39,673 low.Further minor support sits at the 39,638 late February high below which lies the 1989 previous record high at 38,957.
Resistance above Tuesday’s 40,235 high lies at last week’s 40,355 record high.
Nikkei 225 Daily Price Chart
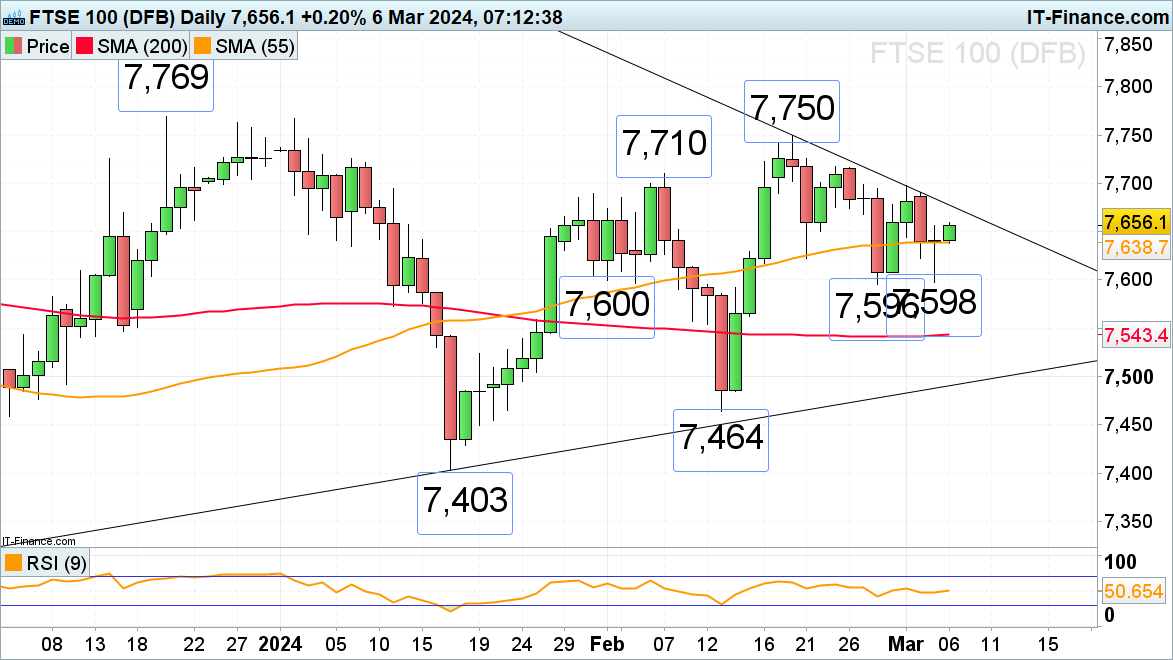
FTSE 100 once more bounces off the 7,600 region
On Tuesday the FTSE 100 fell to last week’s 7,596 low before forming a hammer formation on the daily candlestick chart. This may well have bullish implications if a daily chart close above Tuesday’s high at 7,656 is seen on Wednesday amid the UK budget. If so, the early February and Friday’s highs at 7,697 to 7,710 will be back in focus.
Below key support at 7,598 to 7,596 meanders the 200-day simple moving average (SMA) at 7,543.
FTSE 100 Daily Price Chart
| Change in | Longs | Shorts | OI |
| Daily | -23% | 26% | 1% |
| Weekly | -27% | 40% | 3% |
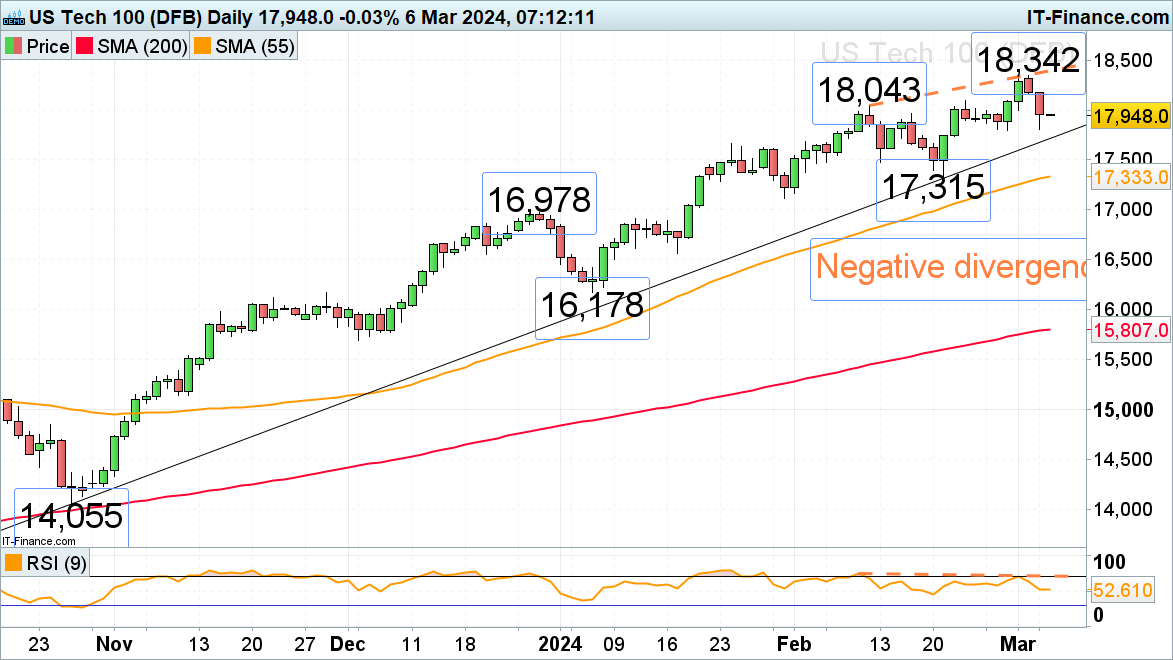
Nasdaq 100 comes off record highs
The Nasdaq 100 has come off Monday’s record high at 18,342 as Apple shares dropped to a four-month low on disappointing iPhone sales in China and Tesla shares slid to a near ten-month low as the German Gigafactory output was halted on power supply issues. The negative divergence seen on the daily RSI, whereby the oscillator didn’t confirm this week’s price record high, warned of such a bearish reversal taking shape.
A possible fall through Tuesday’s low at 17,805 following Fed Chair Jerome Powell’s speech to Congress or US ADP labour data would engage the October-to-March uptrend line at 17,710.
Immediate resistance sits at the 18,043 previous record high, made in mid-February.
Nasdaq 100 Daily Price Chart