
Gold Weekly Forecast: Bearish
- Gold continues to track USD and Treasury yields
- XAU/USD reluctant to break down – $2010 level remains key
- Silver faces short-term resistance but consolidates over the longer-term
- The analysis in this article makes use of chart patterns and key support and resistance levels. For more information visit our comprehensive education library
Recommended by Richard Snow
How to Trade Gold
Gold Continues to Track USD and Treasury Yields
A hotter-than-expected PPI print on Friday added to Tuesday’s stubborn US CPI data, helping lift the US dollar and US yields into the weekend. The chart below depicts the US 2-year treasury yield and the US Dollar Basket (DXY), which both rose on Friday – weighing on metal prices.
Yields and the dollar have rallied this year as the US economy continues to advance at a decent pace, beating expectations despite the constraints of high interest rates. US GDP grew at a rate of 4.9% in Q3 and 3.3% in Q4 with both figures smashing estimates. The Atlanta Fed’s ‘GDPNow’ forecast sees Q1 2024 GDP at 2.9% based off current data. The figure may represent a downgrade from the final quarter of last year but represents a strong base for another potential upward surprise.
Therefore, it appears as if the dollar and market expectations could see further readjustments as the Fed’s first rate cut looks further and further away.
US 2-Year Yields and US Dollar Basket
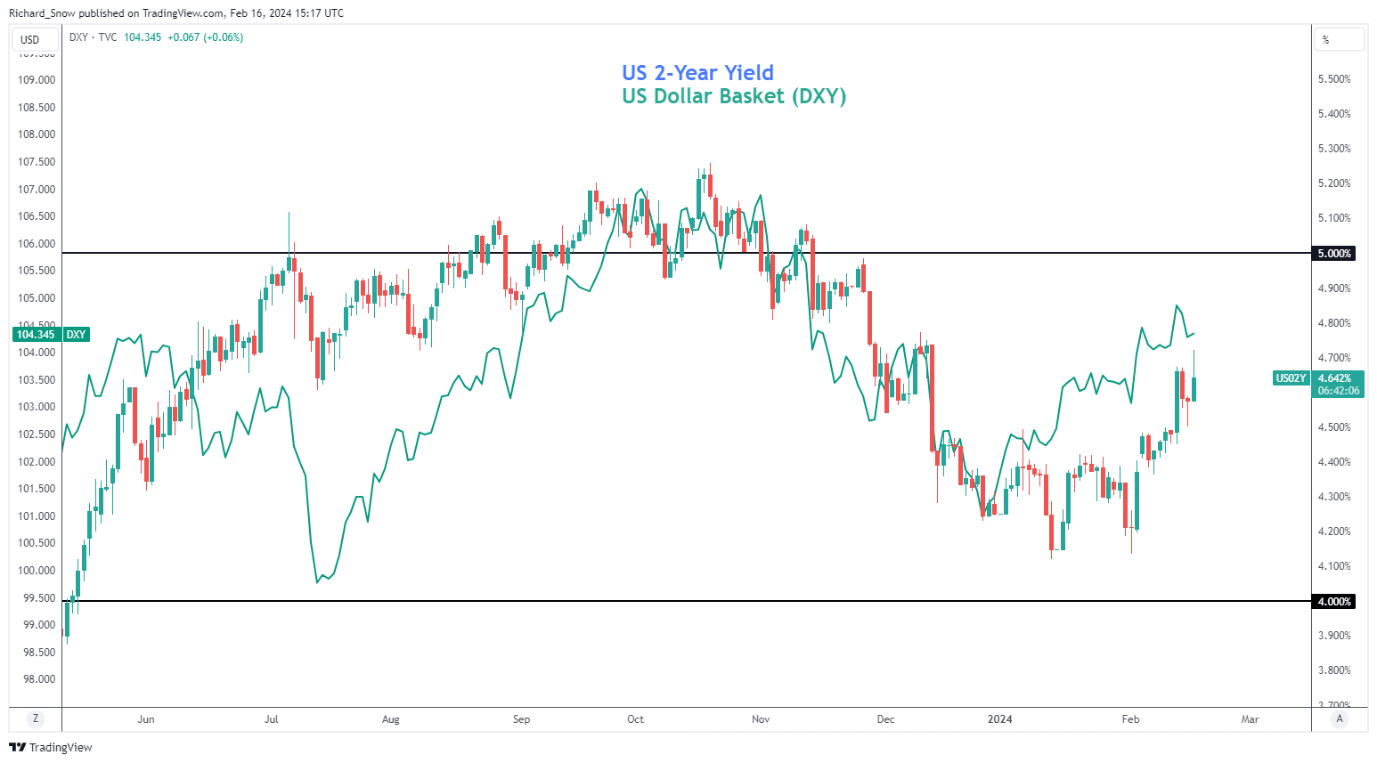
Source: TradingView, prepared by Richard Snow
In addition, implied 30-day gold volatility continues to peter out as global conflict drags on. For context, gold prices tend to thrive in more volatile conditions meaning that the current volatility downturn may limit upside potential for the precious metal.
Implied 30-Day Volatility (GVZ)
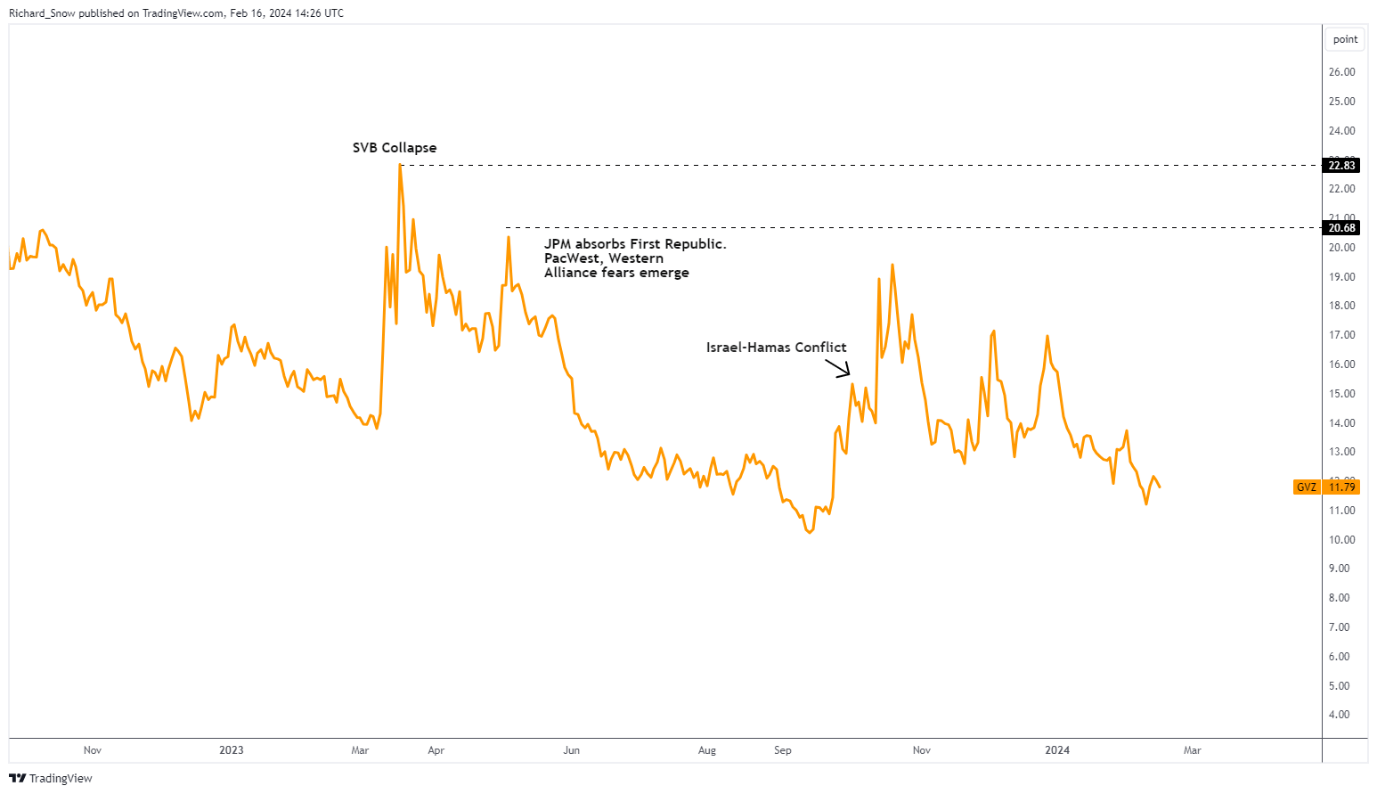
Source: TradingView, prepared by Richard Snow
If you’re puzzled by trading losses, why not take a step in the right direction? Download our guide, “Traits of Successful Traders,” and gain valuable insights to steer clear of common pitfalls:
Recommended by Richard Snow
Traits of Successful Traders
Gold Reluctant to Break Down – $2010 Level Remains Key
Gold appeared on track to close below the zone of support around $2010 but the post PPI dollar pullback saw the precious metal claw back weekly losses. The weekly chart shows persistent pressure on the support zone with lower highs continuing from the end of last year. The narrowing of price action suggests another attempt to break below $2010 is just a matter of time. Next week scheduled event risk is relatively quiet with the FOMC minutes and flash PMI the pick of the ‘high impact’ events that may add to the positive sentiment around the US economy, weighing on gold.
In the event gold does close below the support zone, the next challenge appears via the prior spike lows at $1984 and $1973 respectively. However, failure to overcome the resistance zone, may sideline bears for the time being before inevitably mounting another attempt from more attractive levels. $2050 stands firm as resistance followed by $2075 which appears a long way from current levels.
Gold Weekly Chart
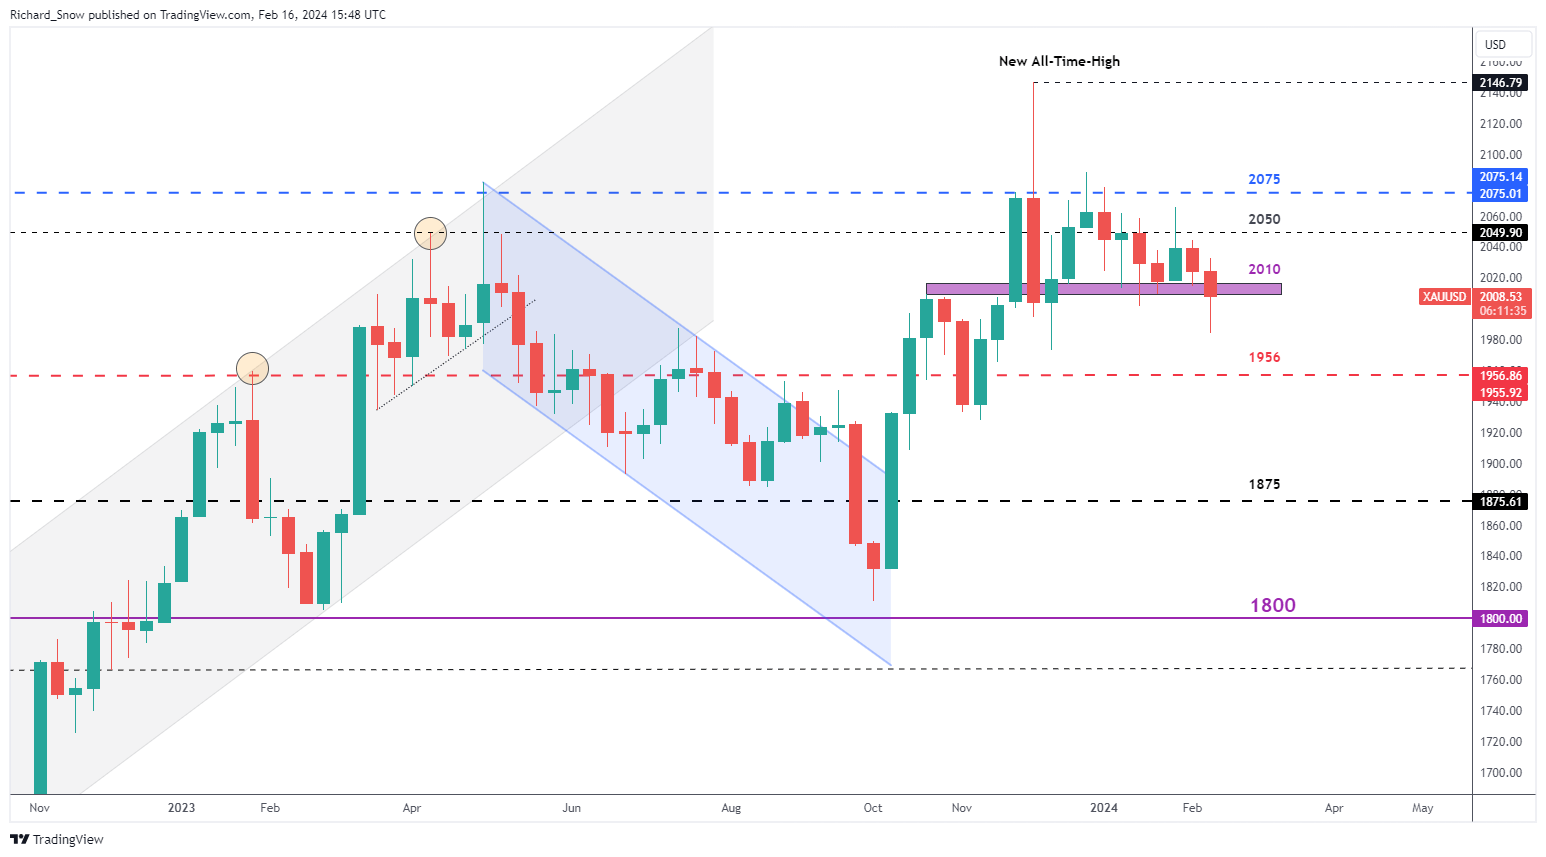
Source: TradingView, prepared by Richard Snow
The daily chart reveals a more bullish outlook for short-term gold prices. On Friday gold rose at the end of the trading session in line with the morning star candlestick pattern provided on Thursday (highlighted in blue).
The pattern attracts greater conviction at the bottom or a mature downtrend but still provides a valuable signal that bearish momentum was halted abruptly, followed by early signs of a move higher. The pattern also found support at $1985 (a prior level of resistance) before reversing higher.
Gold Daily Chart
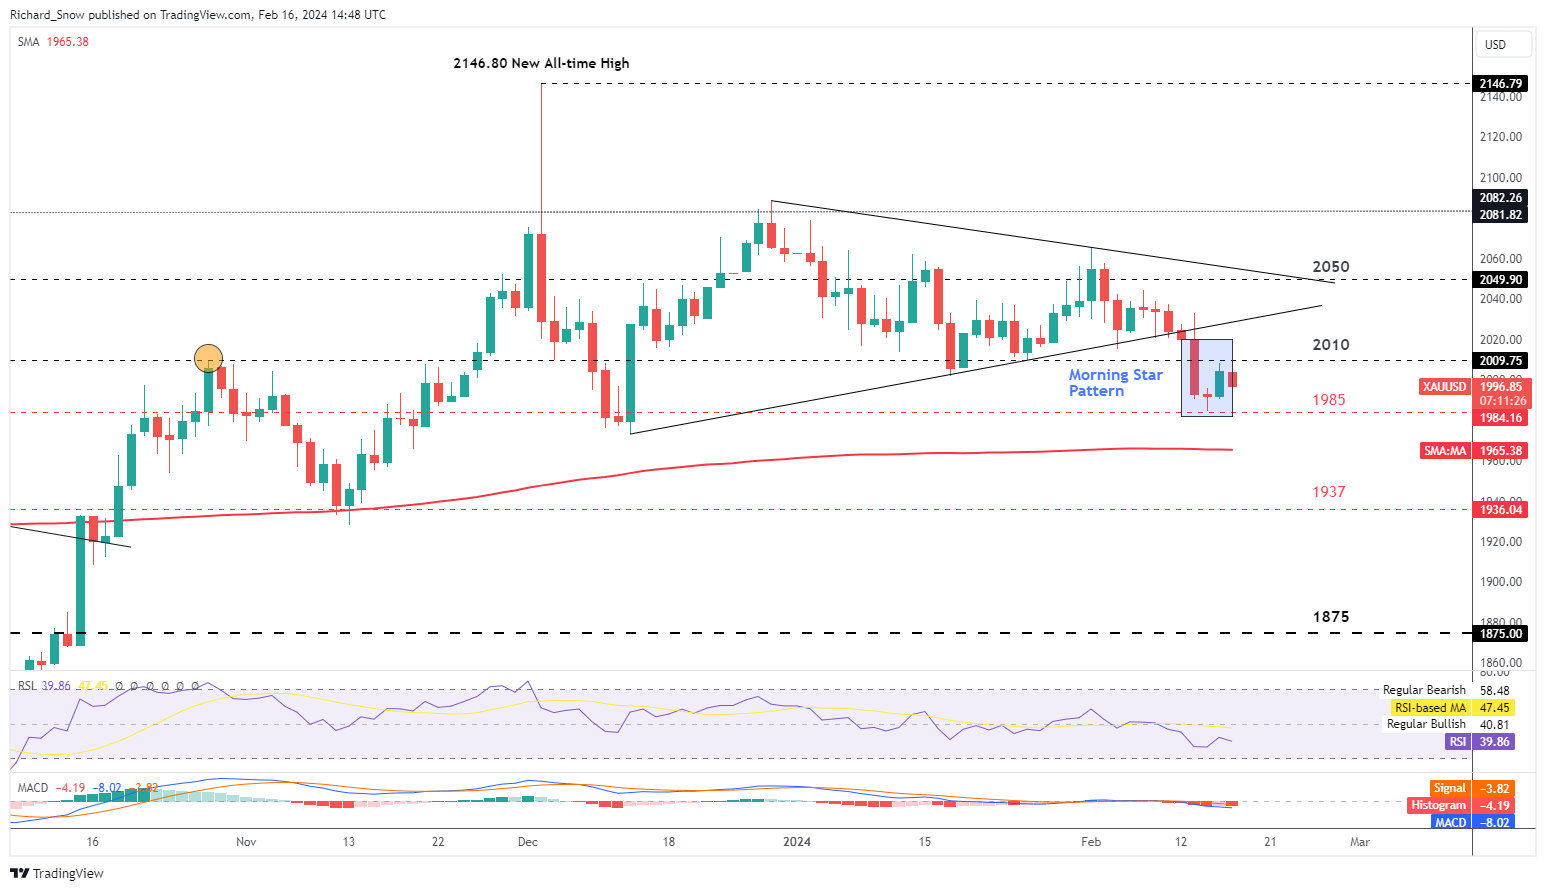
Source: TradingView, prepared by Richard Snow
Trade Smarter – Sign up for the DailyFX Newsletter
Receive timely and compelling market commentary from the DailyFX team
Subscribe to Newsletter
Silver Faces Short-Term Resistance but Consolidates over the Longer-term
The weekly silver chart reveals a strong tendency for prices to find support at the 38.2% Fibonacci retracement of the 2021 to 2022 major decline highlighted as the solid red line ($22.45). As the week draws to a close, prices have attempted once again to close below this key level but without success. Therefore, when taking a step back, it appears that silver prices may be in the midst of a longer-term mean reversion towards $23.90 and even $25.00.
Silver Weekly Chart
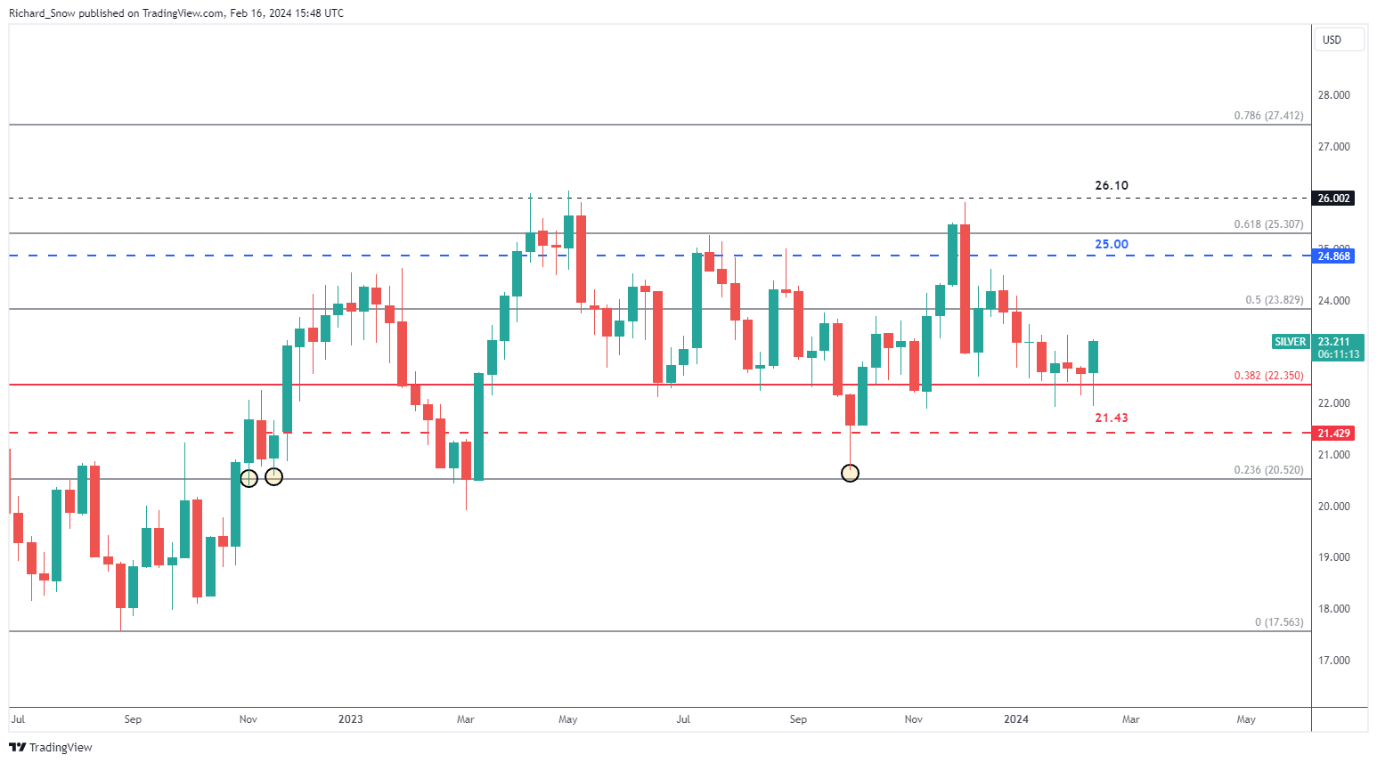
Source: TradingView, prepared by Richard Snow
However, on the daily chart silver appears to have run into a zone of resistance comprised of the 50 and 200-day simple moving averages. The 200 SMA has acted as dynamic resistance for silver during 2024 thus far, capping upside potential for the metal.
Keep a watchful eye on how silver responds to this latest test of bullish resolve in the week to come. This year, the market has been unable to break and close above it opening the door to a retest of $23.30 again.
Silver Daily Chart
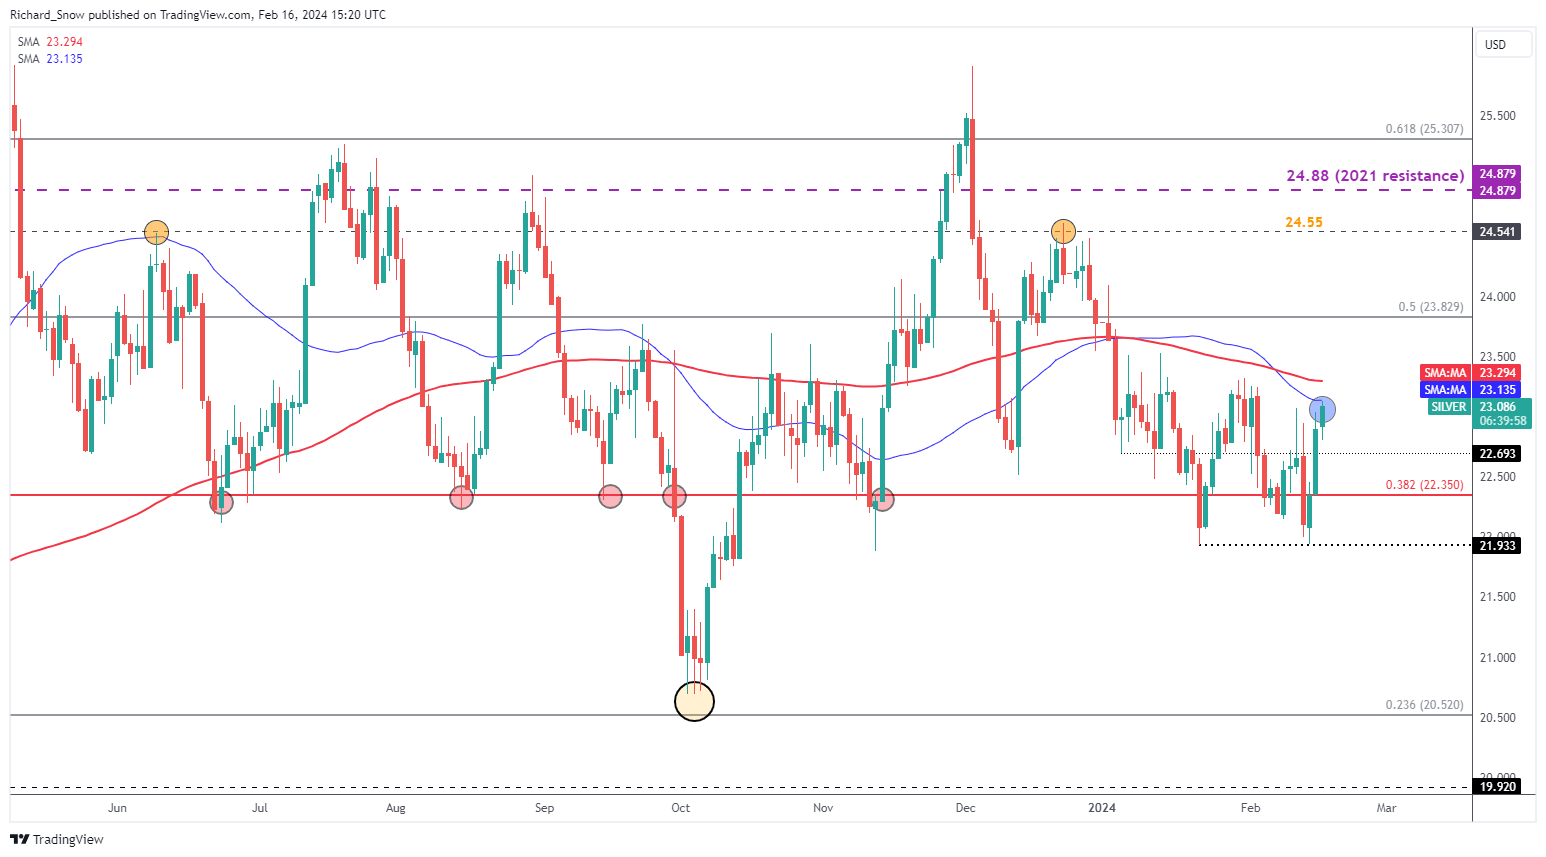
Source: TradingView, prepared by Richard Snow
— Written by Richard Snow for DailyFX.com
Contact and follow Richard on Twitter: @RichardSnowFX