
Japanese Yen, USD/JPY, US Dollar, BoJ, YCC, Federal Reserve, Crude Oil – Talking Points
- The Japanese Yen might need a change in Bank of Japan policy to support it
- Treasury yields remain robust after a small pullback as Fed policy moves into view
- If USD/JPY trades well above 150, volatility could accelerate
Recommended by Daniel McCarthy
Get Your Free JPY Forecast
The Japanese Yen is flirting around recent lows with USD/JPY poking above 150 in early Asian trade but unable to overcome the 150.16 high seen earlier this month.
The 10-year Japanese Government Bond (JGB) is near 0.86%, the highest since 2013. The Nikkei news service is reporting that the Bank of Japan is considering tweaking its yield curve control program (YCC).
This follows on from speculation last week that the bank is considering raising its policy rate from below -0.10%.
If USD/JPY makes a clean break above 150 the 33-year high of 151.95 might move into view.
Such a move may also see physical intervention from the BoJ in currency markets. Historically, central bank intervention tends to be most effective when done in combination with supportive fundamental factors.
This places the importance of any BoJ adjustments to the policy rate or YCC at the front of the market’s mind.
Elsewhere, Treasury yields have ticked up to start the week after easing into the weekend with the Federal Reserve now in a blackout period ahead of its Federal Open Market Committee (FOMC) meeting starting October 31st.
The benchmark 10-year note traded at its highest level since 2007, nudging over 5.0% on Friday and remains near there going into Monday’s session.
Before the cone of silence was lowered, Cleveland Federal Reserve President Loretta Mester added to the growing chorus of board members hinting toward a peak in the policy rate when she said, “We are likely near or at a holding point on the funds rate.”
APAC equity indices have followed the Wall Street lead from Friday with all the major markets bathed in a sea of red. India’s stock exchanges have faired a bit better, trading almost flat for the day.
Spot gold has eased to start the week after failing to clear US$ 2,000 on Friday. Crude oil has also given up some of its recent gains as energy markets ponder the geopolitical backdrop in the Middle East.
Looking ahead to this week, the Bank of Canada (BoC) and the European Central Bank (ECB) will be making monetary policy decisions on Tuesday and Thursday respectively while Australia will see crucial 3Q CPI data on Wednesday ahead of US GDP, also on Thursday.
The full economic calendar can be viewed here.
Recommended by Daniel McCarthy
How to Trade USD/JPY
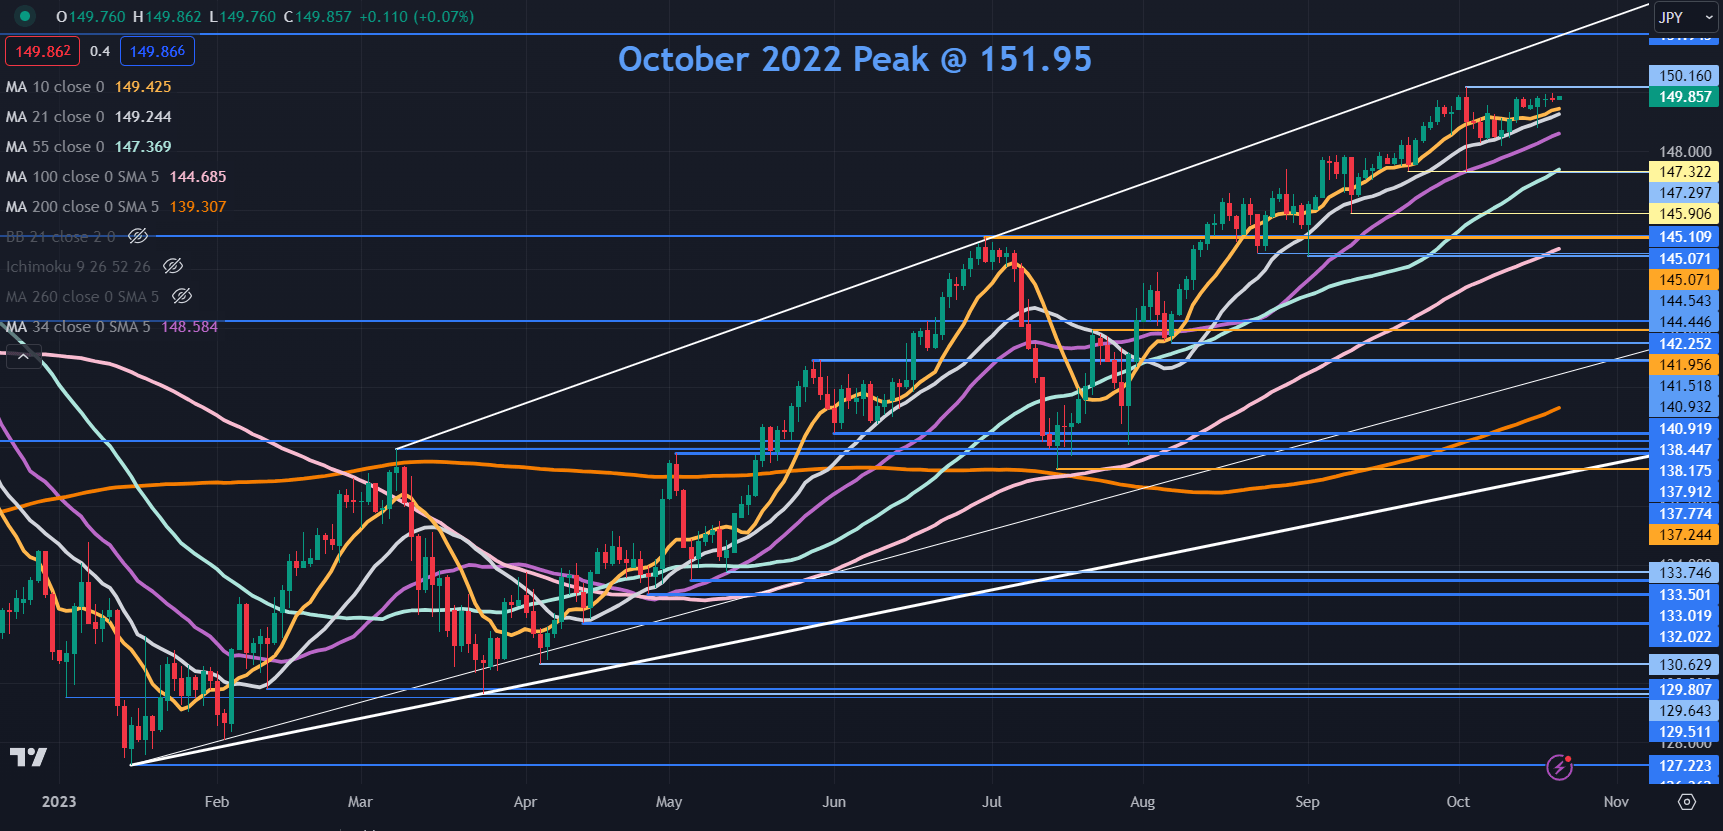
USD/JPY TECHNICAL ANALYSIS UPDATE
USD/JPY may have bullish momentum intact for now as it inches closer to the 12-month high seen earlier this month at 150.16. A break above there could see a run toward the 33-year peak seen at this time last year at 151.95.
A bullish triple moving average (TMA) formation requires the price to be above the short-term SMA, the latter to be above the medium-term SMA and the medium-term SMA to be above the long-term SMA. All SMAs also need to have a positive gradient.
When looking at any combination of the 10-, 21-, 34-, 55-, 100- and 200-day SMAs, the criteria for a TMA have been met and might suggest that bullish momentum is evolving. For more information on trend trading, click on the banner below.
On the downside, support may lie at the recent lows near 147.30 and 145.90 or further down at the breakpoints in the 145.05 – 145.10 area ahead of the prior lows near 144.50 and 141.50.
Recommended by Daniel McCarthy
The Fundamentals of Trend Trading
— Written by Daniel McCarthy, Strategist for DailyFX.com
Please contact Daniel via @DanMcCarthyFX on Twitter