
HANG SENG, KOSPI, TOPIX – Price Action:
- The Hang Seng Index, Kospi, and Topix have maintained a weak bias.
- Asian indices are at key support ahead of the US Fed interest rate decision.
- What is the outlook and the key levels to watch?
Supercharge your trading prowess with an in-depth analysis of US Equities, offering insights from both fundamental and technical viewpoints. Claim your free Q4 trading guide now!
Recommended by Manish Jaradi
Get Your Free Equities Forecast
Hang Seng Index: Downward momentum is increasing
The sequence of lower-highs-lower-lows since early 2023 is a sign that the Hang Seng Index’s trend remains down. The index is now attempting to fall below vital support on the lower edge of a declining channel since early 2023. A decisive break below could pave the way toward the 2022 low of 14600. While oversold conditions and a string of policy measures have at best led to minor pauses within the downtrend so far. For more discussion see, “Q4 Trade Opportunity: HK/China Equities Could be Due for a Rebound,” published October 9.
Hang Seng Index Weekly Chart
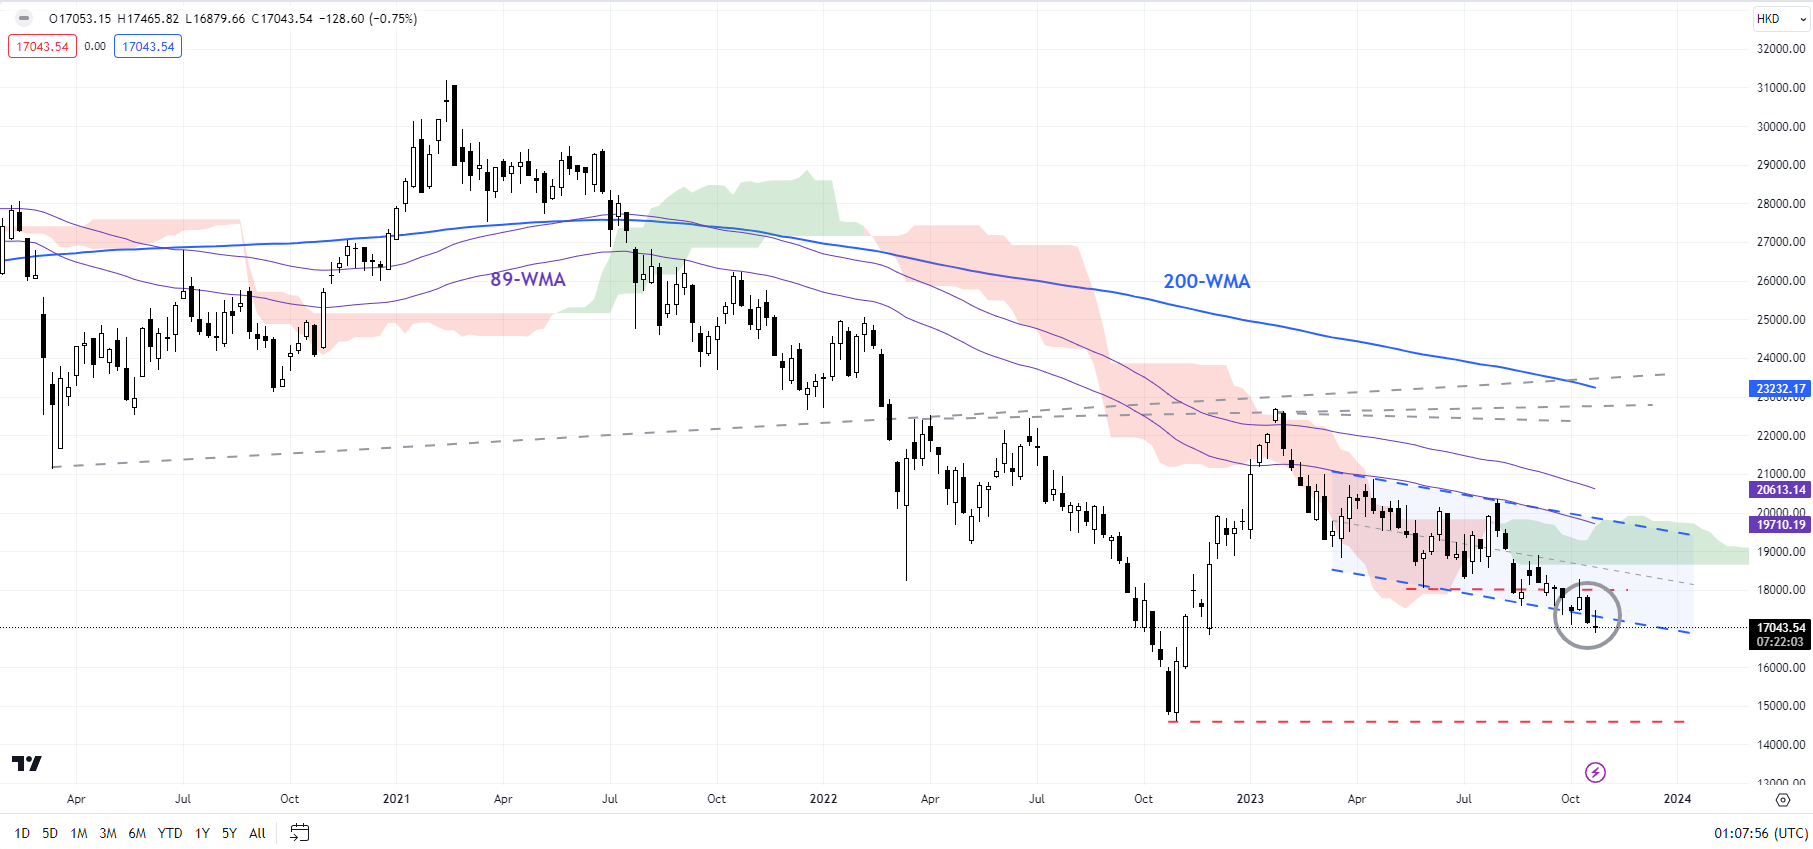
Chart Created Using TradingView
At a minimum, the Hang Seng Index needs to cross above the mid-October high of 18300 for the downward pressure to begin fading. For a sustained rebound, the index would need to cross several hurdles, including the upper edge of the channel, near the August high of 20350.
Kospi: Approaches a vital floor
Kospi’s break in August has truncated the nine-month-long recovery. This follows a failure in mid-2023 to cross above a major hurdle at the January low of 2590. Kospi’s fall this week to the lowest level since January means the target of the double top pattern (the June and August highs) of around 2380 has been achieved.
Kospi Weekly Chart
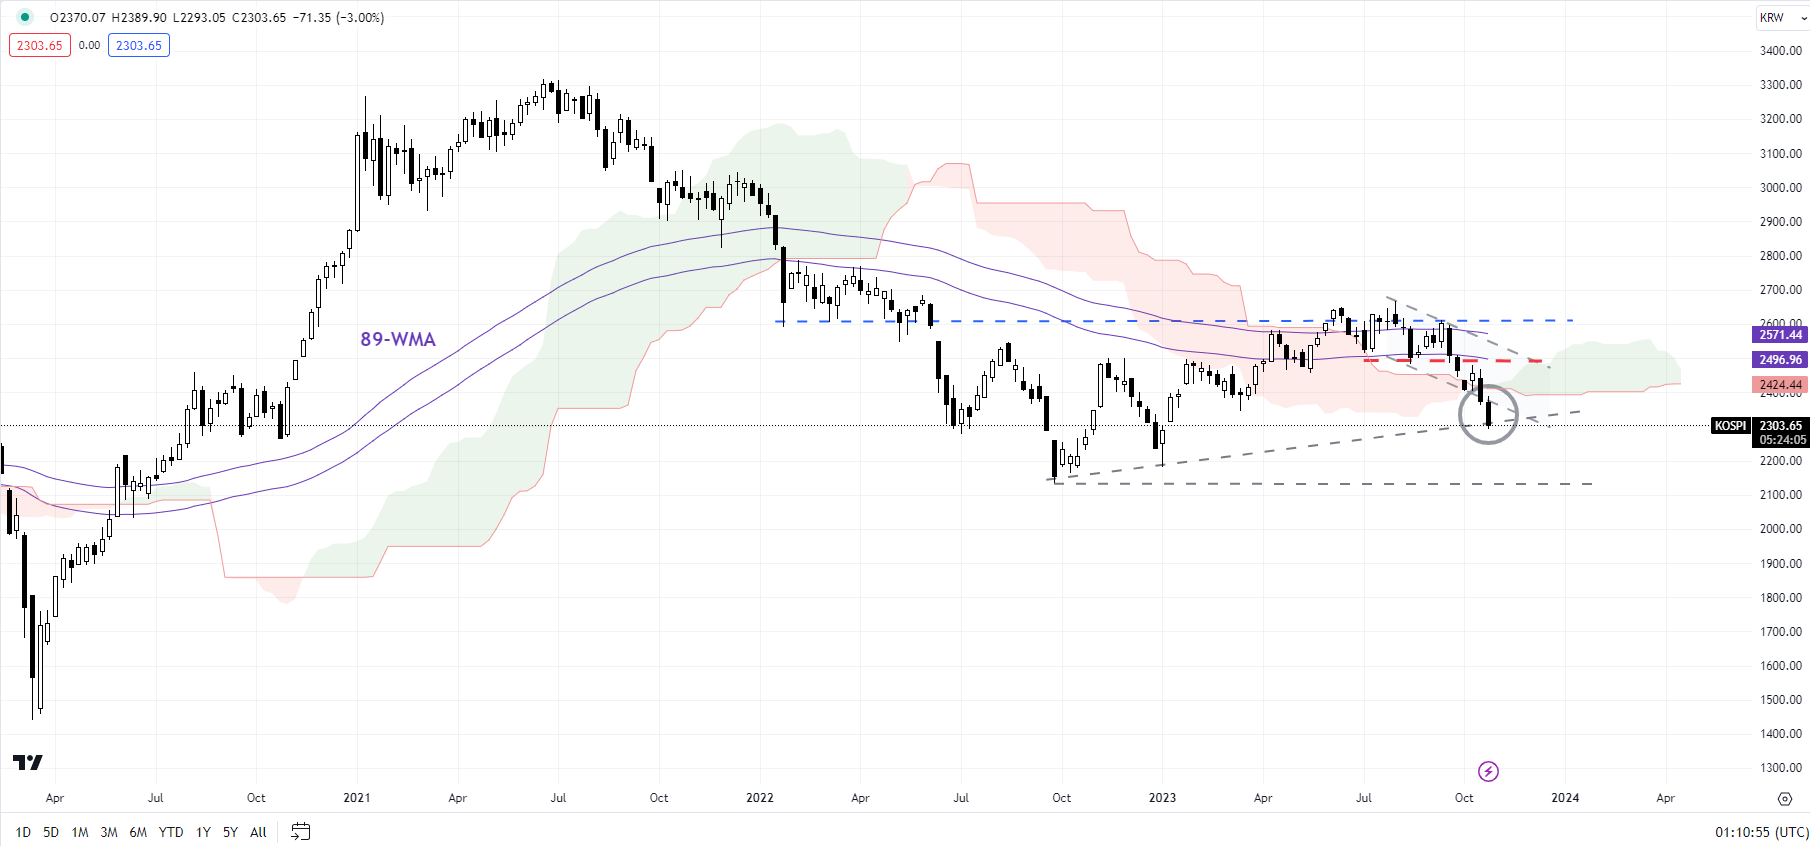
Chart Created Using TradingView
Ashighlighted in the previous update, while there is no doubt that the bullish pressure has dissipated, Kospi would need to fall under the 2022 low of 2135, slightly above the 200-month moving average (now at about 2085) for downside risks to accentuate. The last time the index was decisively below the long-term moving average was in 2003.
Topix: Holds above strong cushion
Topix is holding above key support on a horizontal trendline from mid-2023 (at about 2200). Ashighlighted in the previous update, this cushion is strong and might not be broken easily. However, any break below would disrupt the higher-highs-higher-lows sequence prevailing in recent months, suggesting a temporary easing in the upward pressure. Any break below 2200 could open the door toward the 200-day moving average (now at about 2150).
Topix Daily Chart
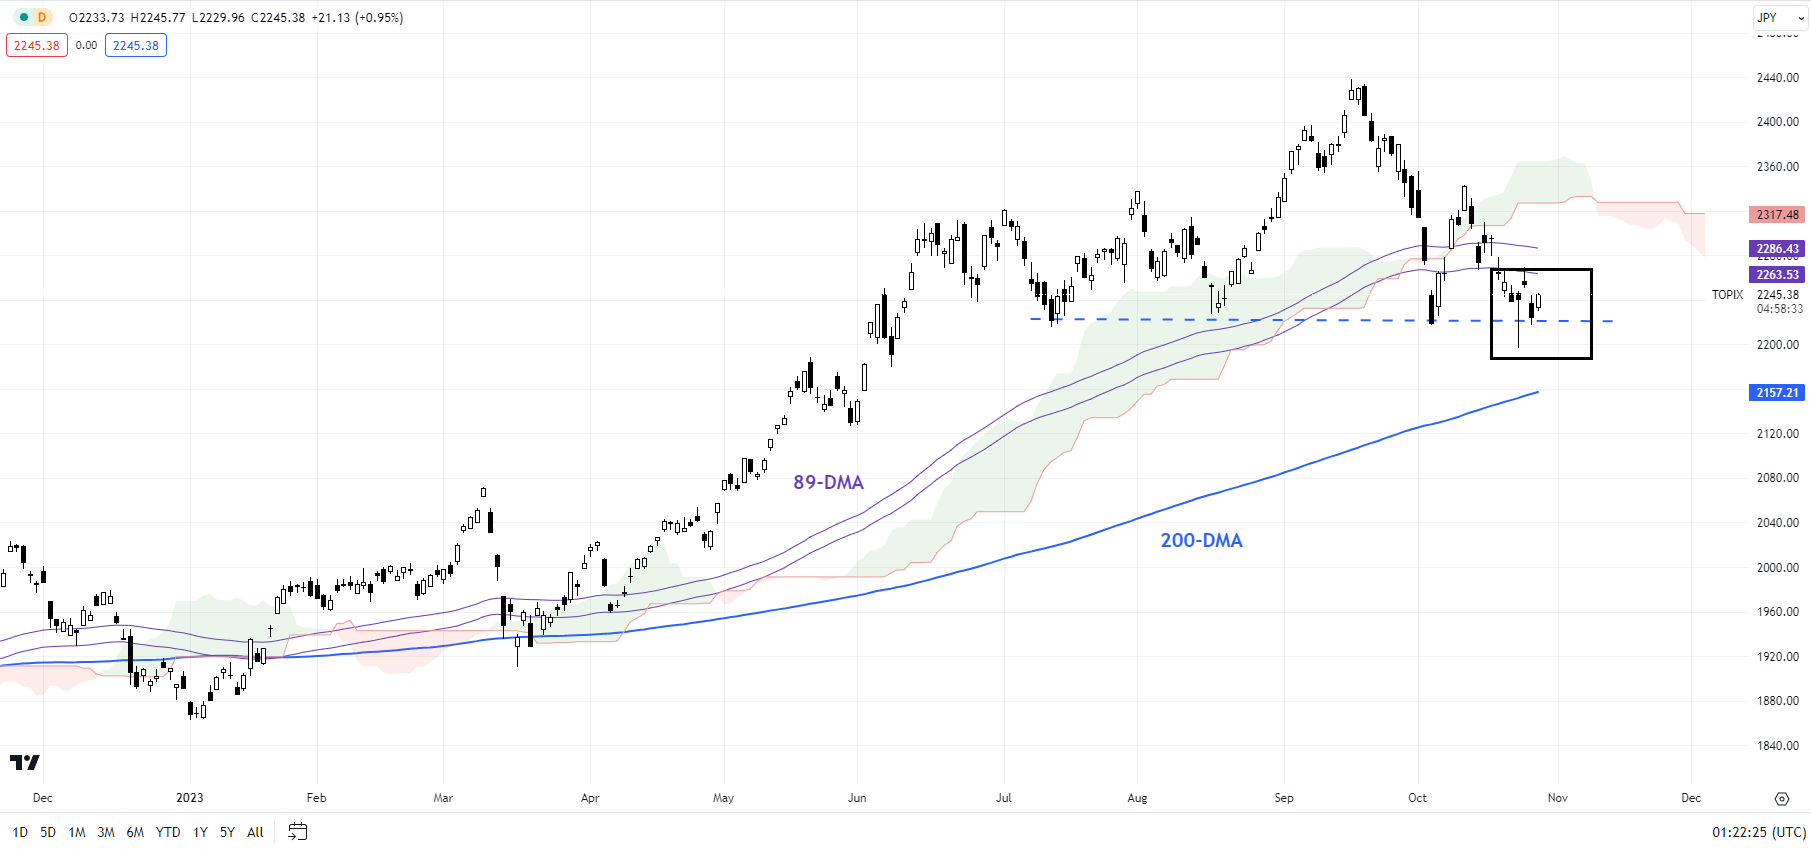
Chart Created Using TradingView
Zooming out, from a big-picture perspective, the index has shown gradual signs of strength in recent years, with the break above a horizontal trendline from the mid-1990s turning out to be unambiguously bullish. Unless the index falls below the resistance-turned-support at the 2021 high of 2120, the broader bullish picture remains intact.
Looking for actionable trading ideas? Download our top trading opportunities guide packed with insightful tips for the fourth quarter!
Recommended by Manish Jaradi
Get Your Free Top Trading Opportunities Forecast