
Gold (XAU/USD), Silver (XAG/USD) Analysis and Chart
- Gold under pressure as US rate cut expectations are reined in.
- Silver boxed in and sitting in neutral territory.
Most Read: Gold (XAU/USD) Nudges Higher in Early Trade, Resistance Levels Near
With all of this week’s excitement in the US equity space, and especially Nvidia, gold and silver have been left on the sidelines waiting for a macro driver. Next week’s economic calendar has a range of potential volatility drivers with next Wednesday’s US Q4 GDP reading, and Thursday’s Core PCE release as the two most likely candidates to drive price action.
For all market-moving economic data and events, see the DailyFX Economic Calendar.
Learn How to Trade Economic Releases with our Complimentary Guide
Recommended by Nick Cawley
Trading Forex News: The Strategy
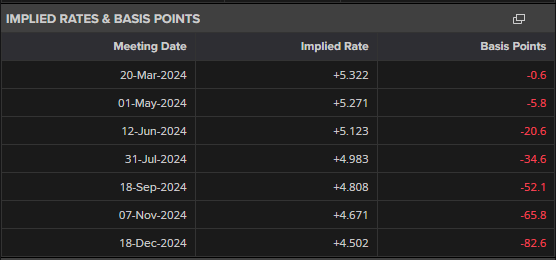
Commentary over the last few weeks from various Federal Reserve board members has centered around reeling in what the US central believed to be excessive rate cut euphoria. At the end of 2023, the markets were pricing in around 170 basis points of interest rate cuts for this year with the first at the March meeting. The Fed’s stance of three cuts with the first in H2 was at first deemed to be too little, too late, but their persistence and some helpful data releases have seen the market fall into line. The latest market probabilities are for 83 basis points of cuts with the first cut fully priced in at the July 31st meeting.
Recommended by Nick Cawley
How to Trade Gold
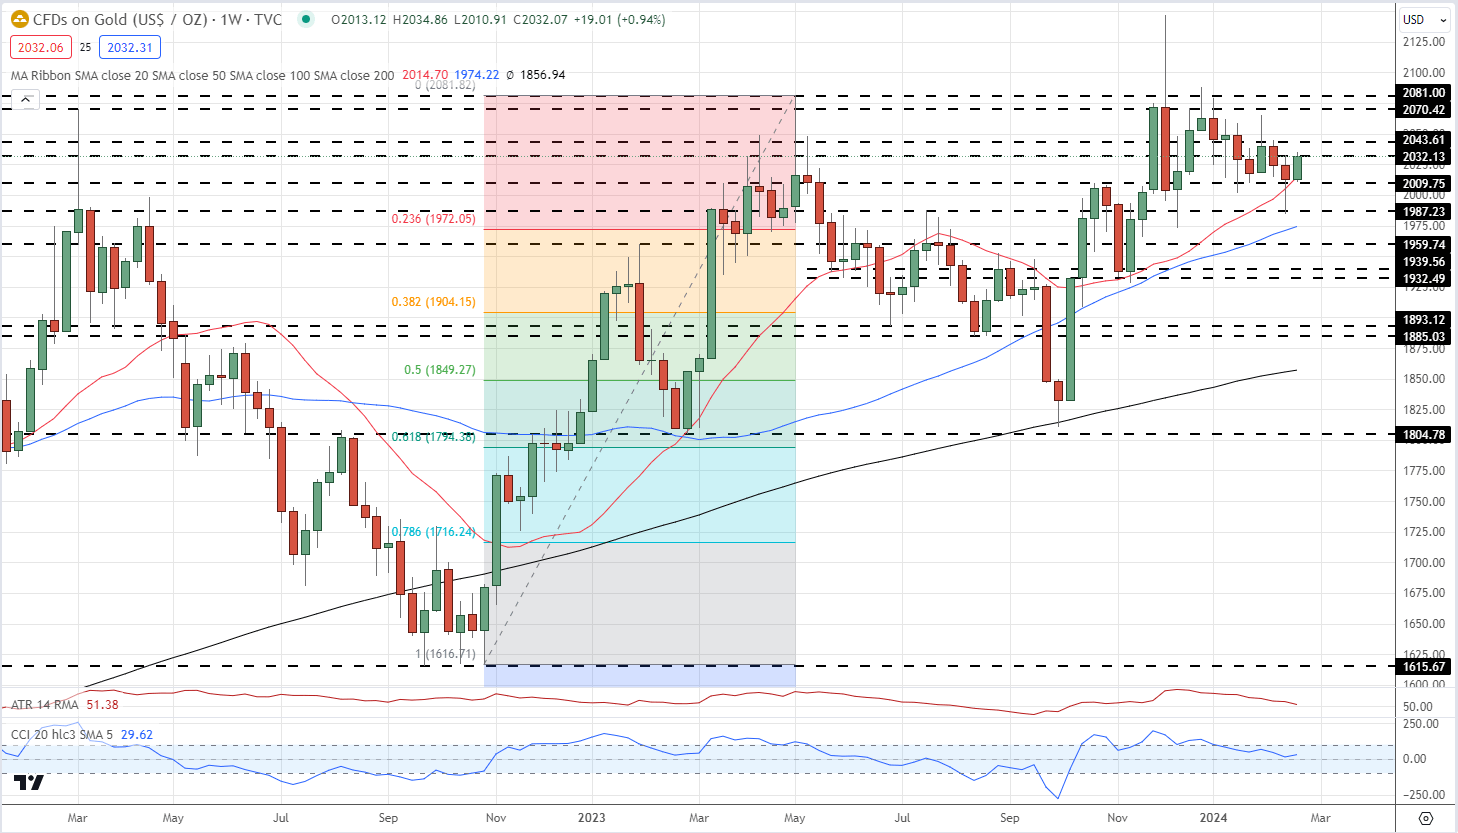
This paring of cut expectations has weighed slightly on gold, capping further upside. Gold has lost around $100/oz. this year and the weekly chart shows a negative trend still in play. A break below $1,984/oz. is needed to keep this trend in place. A break above $2,044/oz. brings $2,070/oz. back into focus.
Gold Weekly Price Chart
Retail trader data shows 61.86% of traders are net-long with the ratio of traders long to short at 1.62 to 1.The number of traders net-long is 2.27% higher than yesterday and 16.48% lower than last week, while the number of traders net-short is 8.12% lower than yesterday and 13.21% higher than last week.
We typically take a contrarian view to crowd sentiment, and the fact traders are net-long suggests Gold prices may continue to fall.
| Change in | Longs | Shorts | OI |
| Daily | -13% | 10% | -4% |
| Weekly | -17% | 24% | -3% |
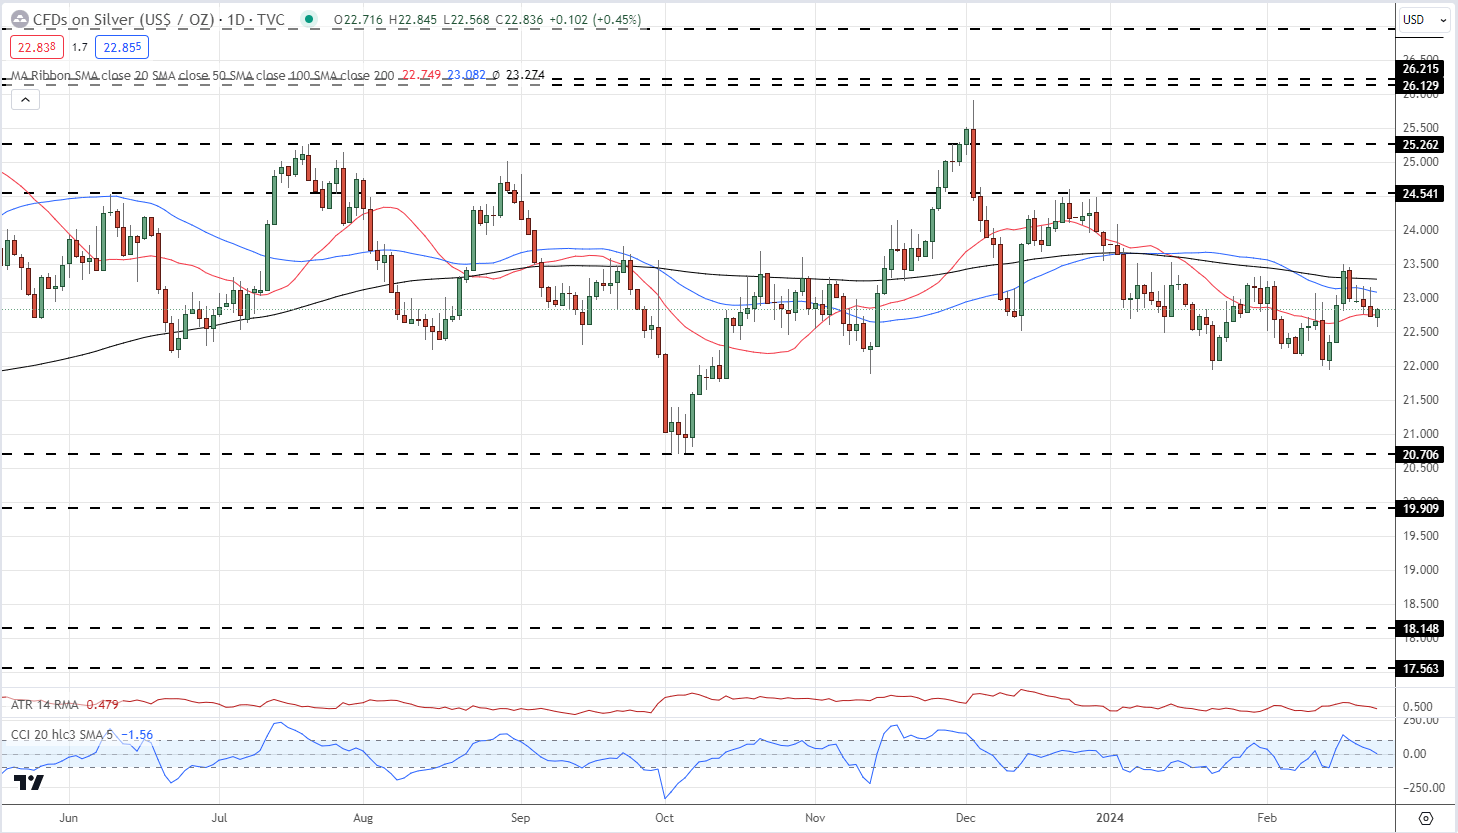
Silver remains boxed in a multi-month $20.76 to $26.13 range, and using the CCI indicator at the bottom of the chart, is in neutral territory, neither overbought nor oversold. The current spot price is below the 200- and the 50-day simple moving averages and is currently trading on either side of the 20-dsma. A confirmed break the shorter-dated sma would see silver eye $22, while a break above the 50- and 200-day smas would see short-term resistance at $23.50 come into focus.
Silver Daily Price Chart
What is your view on Gold and Silver – bullish or bearish?? You can let us know via the form at the end of this piece or you can contact the author via Twitter @nickcawley1.