
Gold Weekly Forecast – Bearish
- Gold’s rally stopped in its tracks after a blistering US Jobs Report
- US rate cut expectations continue to be reined in.
Recommended by Nick Cawley
Get Your Free Gold Forecast
Most Read: US Dollar Holding Post-FOMC Gains for Now, Gold Continues to Nudge Higher
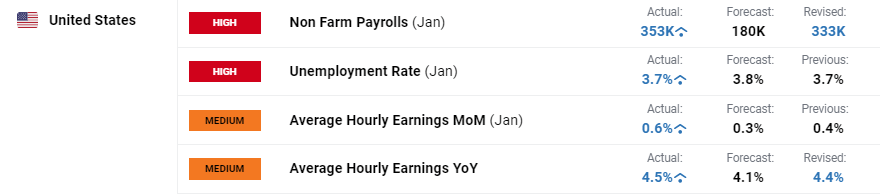
The January US Jobs Report surprised the market on Friday as 353k new jobs were added compared to forecasts of 180k. In addition, the December number was revised sharply higher, from 216k to 333k, while average hourly earnings y/y rose to 4.5% from an upwardly revised 4.4% and a forecast of 4.1%. The US labor market remains robust and will allow the Fed more breathing room to study inflation data over the coming weeks before they decide when they will start reducing borrowing costs. A March rate cut, widely forecast over the past few weeks, is now looking increasingly unlikely, while a total of 125 basis points of cuts is now seen in 2024, down from around 150 basis points at the start of the year.
After a week of heavyweight economic data releases and events, not to mention earnings from five of the Mag 7 tech stocks, the week ahead is altogether calmer with little on the docket to steer risk sentiment. We can expect a fresh round of Federal Reserve commentary now that the FOMC blackout period has passed.
For all economic data releases and events see the DailyFX Economic Calendar
With US rates now looking to stay untouched for longer than previously forecast, non-interest-bearing gold will struggle to move higher in the short-term. The precious metal may receive a haven boost from any heightening of tensions in the Middle East, but the interest rate backdrop will remain the dominant driver.
Gold is testing prior horizontal support around $2,033/0z. and both the 20- and 50-day simple moving averages. A short-term series of higher lows has been broken and unless buyers step in, the precious metal will likely test support around $2,010/oz. and then $2,000/oz. The upside looks limited in the coming days with recent prior highs up to $2,065/oz. likely to prove difficult to break.
Learn How to Trade Gold with our Expert Guide
Recommended by Nick Cawley
Get Your Free Gold Forecast
Gold Daily Price Chart
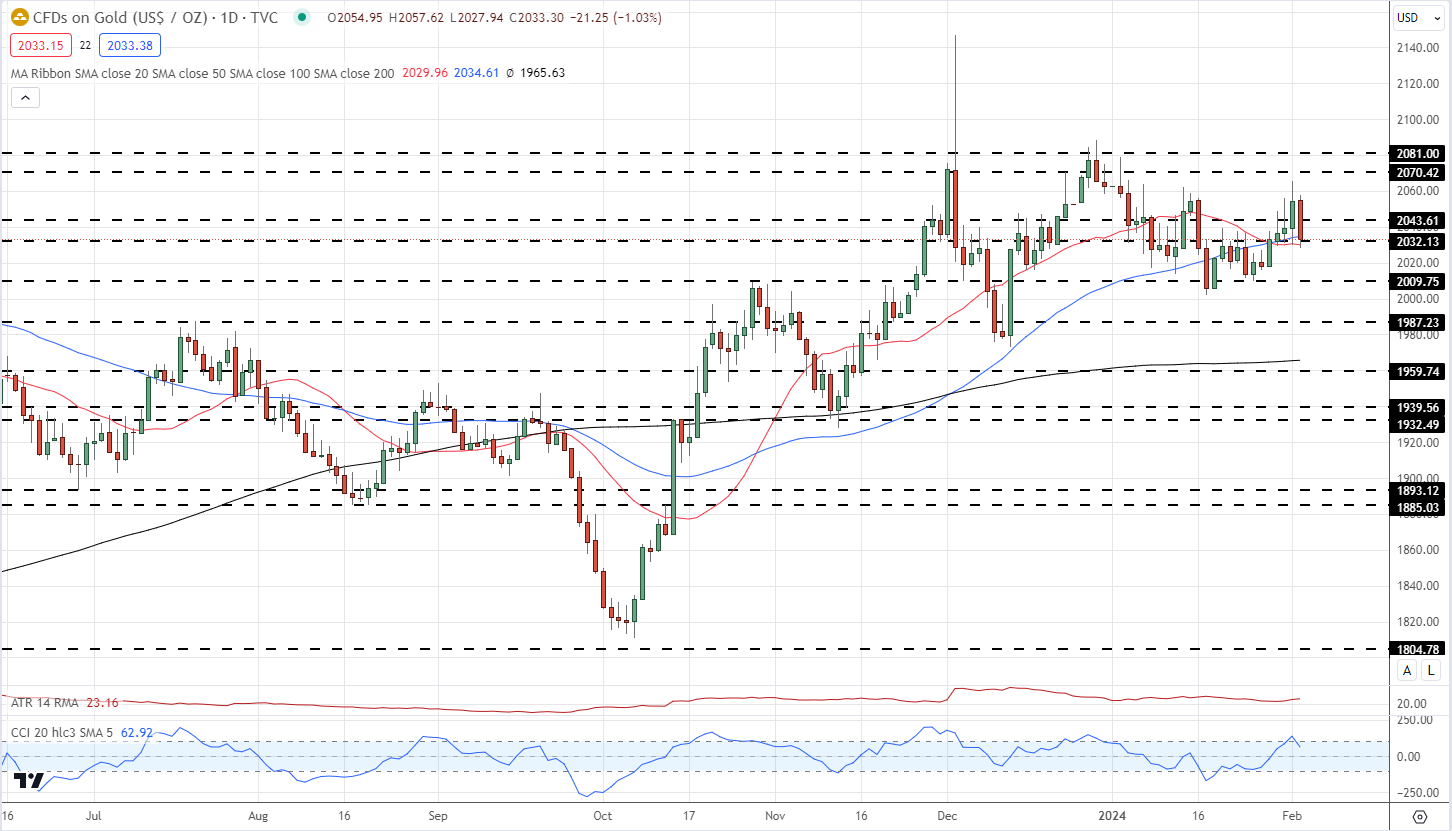
Chart via TradingView
Retail trader data show 53.76% of traders are net-long with the ratio of traders long to short at 1.16 to 1.The number of traders’ net long is 6.08% lower than yesterday and 12.28% lower than last week, while the number of traders’ net short is 26.89% higher than yesterday and 18.84% higher than last week.
We typically take a contrarian view to crowd sentiment, and the fact traders are net-long suggests Gold prices may continue to fall.
See how daily and weekly changes in IG Retail Trader data can affect sentiment and price action.
| Change in | Longs | Shorts | OI |
| Daily | -3% | -3% | -3% |
| Weekly | -26% | 30% | -10% |
What is your view on Gold – bullish or bearish?? You can let us know via the form at the end of this piece or you can contact the author via Twitter @nickcawley1.