
Gold Price Outlook, Analysis and Charts
- US/UK forces attack Houthi positions in Yemen.
- Falling short-end US Treasury yields boost gold’s appeal
- Technical setup for gold remains positive.
Download our free Q1 2024 Gold Forecast below:
Recommended by Nick Cawley
Get Your Free Gold Forecast
Gold is getting a decent boost going into the weekend and beyond on a combination of escalating geopolitical tensions and a weaker US dollar. Last night’s US/UK coordinated attacks on Houthi rebels in Yemen have prompted fears of reprisals, and with both sides unlikely to back down the already fraught situation is likely to get worse.
Crude Oil Latest: Heightened Geopolitical Tensions Push Oil Prices Higher
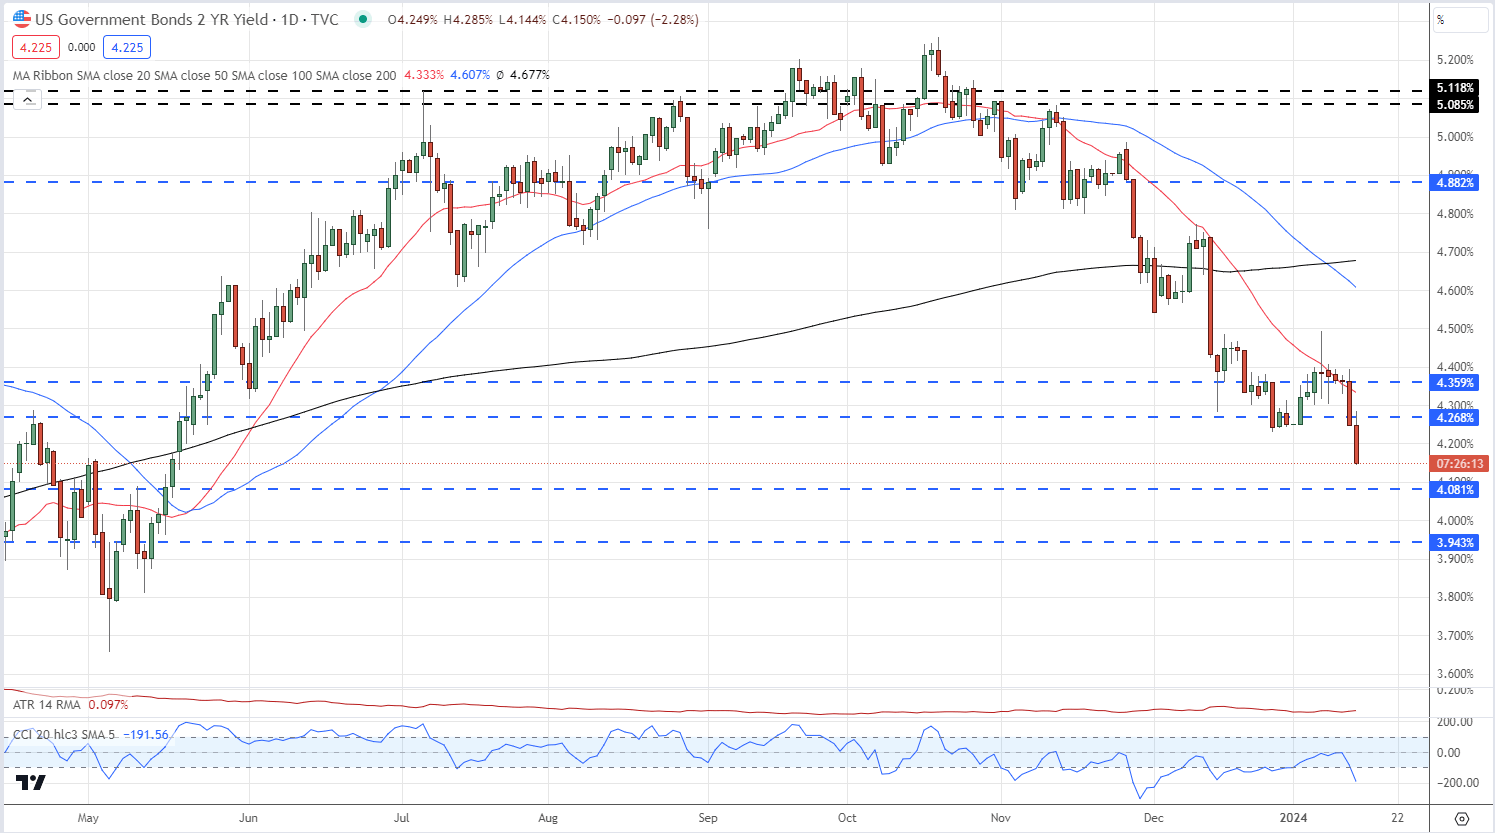
Short-dated US Treasury yields have been moving lower over the last few months as traders continue to price in a series of US interest rate cuts. The latest CME Fed Watch tool suggests the Federal Reserve will cut interest rates by a total of 150 basis points next year with the first of six quarter-point clips seen in March. The interest-rate sensitive US 2-year Treasury currently trades with a yield of 4,15%, down from a multi-year peak of 5.26% in mid-October and at the lowest level seen since mid-May last year. The latest leg lower in US yields is being driven by a combination of haven buying, Middle East fears, and rate expectations.
UST 2-Year Yield
For all economic data releases and events see the DailyFX Economic Calendar
The technical outlook for gold also looks positive and further gains look likely, especially if the fundamental background remains the same. The series of higher lows and higher highs, leaving aside the December 4th spike, remains in place and is guiding gold higher, while a close, and open, above the 20-day simple moving average would help confirm the bullish outlook. The CCI indicator is turning higher and is moving from a multi-week oversold low. A break above the late-December $2089/oz. high would leave $2,100/oz. and then the $2,044/oz. spike vulnerable.
Recommended by Nick Cawley
How to Trade Gold
Gold Daily Price Chart
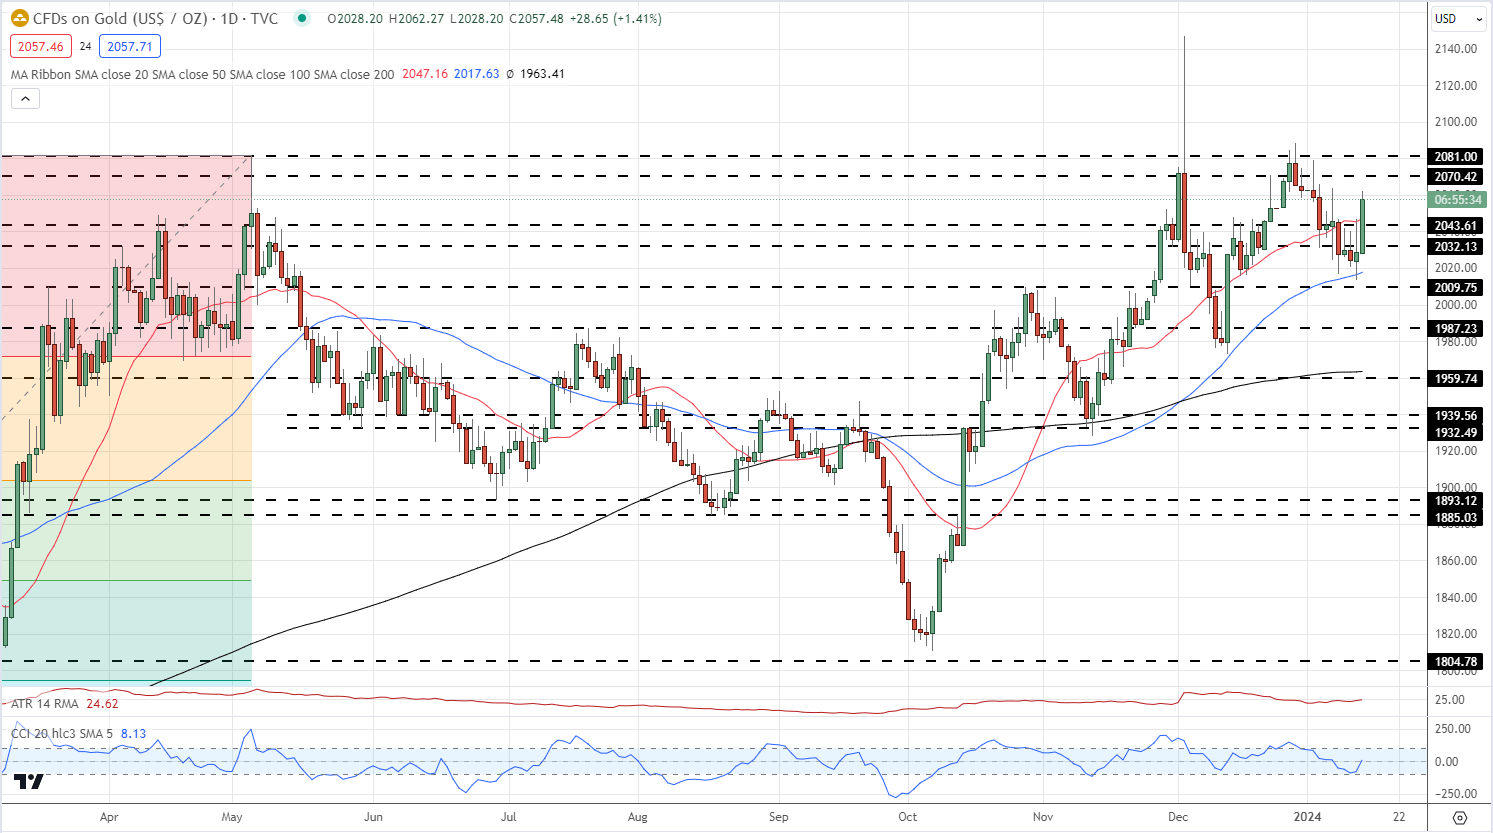
Chart via TradingView
Retail trader data shows 58.42% of traders are net-long with the ratio of traders long to short at 1.40 to 1.The number of traders net-long is 1.90% higher than yesterday and 2.68% higher from last week, while the number of traders net-short is 4.90% lower than yesterday and 0.98% lower from last week.
We typically take a contrarian view to crowd sentiment, and the fact traders are net-long suggests Gold prices may continue to fall.
See how changes in IG Retail Trader data can affect sentiment and price action.
| Change in | Longs | Shorts | OI |
| Daily | -13% | 10% | -4% |
| Weekly | -17% | 24% | -3% |
What is your view on Gold – bullish or bearish?? You can let us know via the form at the end of this piece or you can contact the author via Twitter @nickcawley1.