
GOLD, XAU/USD, US Dollar, 10-Year Treasury Yield, Ackman, Gross, BTC – Talking Points
- Gold has struggled despite a softening in the US Dollar
- Treasury yields might have peaked if the big guns are to be believed
- If gold can’t rally on a weaker USD, will it mean revert?
Recommended by Daniel McCarthy
Get Your Free Gold Forecast
The gold price has recovered some of the ground lost overnight as markets recalibrate on the prospect of a possible peak in Treasury yields at the long end.
Treasury yields peeled lower after tweets from famed investors, Bill Ackman and Bill Gross signalled a shift in their view of US government debt.
Ackman said that he had covered his short bond position due to concerns about the outlook for the US economy.
Bill Gross was a bit more nuanced, looking at curve trades and outright buying of short-term interest rate futures but both investors said that they have been sellers of long-end bonds of late.
The 10-year note eclipsed 5.02% in the US session before rolling over and touching 4.83% going into the close. It remains near the low so far today.
In all that carnage, the DXY (USD) index dipped to a four-week low and is seen as weaker across the board over the last 24 hours. EUR/USD has continued higher after breaking above a descending trend line last week. Despite the lower US Dollar, the gold price has been unable to capitalise on it.
Recommended by Daniel McCarthy
How to Trade Gold
USD/JPY remains in a tight range after the Bank of Japan announced an unscheduled bond buying operation as FX markets weigh the possibility of physical intervention should the price rise significantly above 150.
The Australian Dollar has reclaimed 0.6350 today ahead of a speech by RBA Governor Michele during today’s European session.
3Q Australian CPI will be released tomorrow, and it is likely to be crucial for the RBA’s monetary policy deliberations at its November gathering.
Bitcoin added to overnight gains, trading above USD 35,000 today for the first time since May 2022 to be around 15% higher to start the week.
It appears that speculation on a spot Bitcoin ETF getting approval for U.S. investors might have squeezed some shorts in the product.
Crude oil is languishing going into Tuesday’s session after easing lower on the possibility of a delay in the outbreak of urban warfare in Palestine.
The S&P 500 index broke below the 200-day simple moving average (SMA) on Monday and remains below it today. APAC equities have had a fairly mixed day with slight gains and losses for the major indices.
After UK jobs data today, a series of PMI numbers will hit the screens from across Europe and the US.
The full economic calendar can be viewed here.
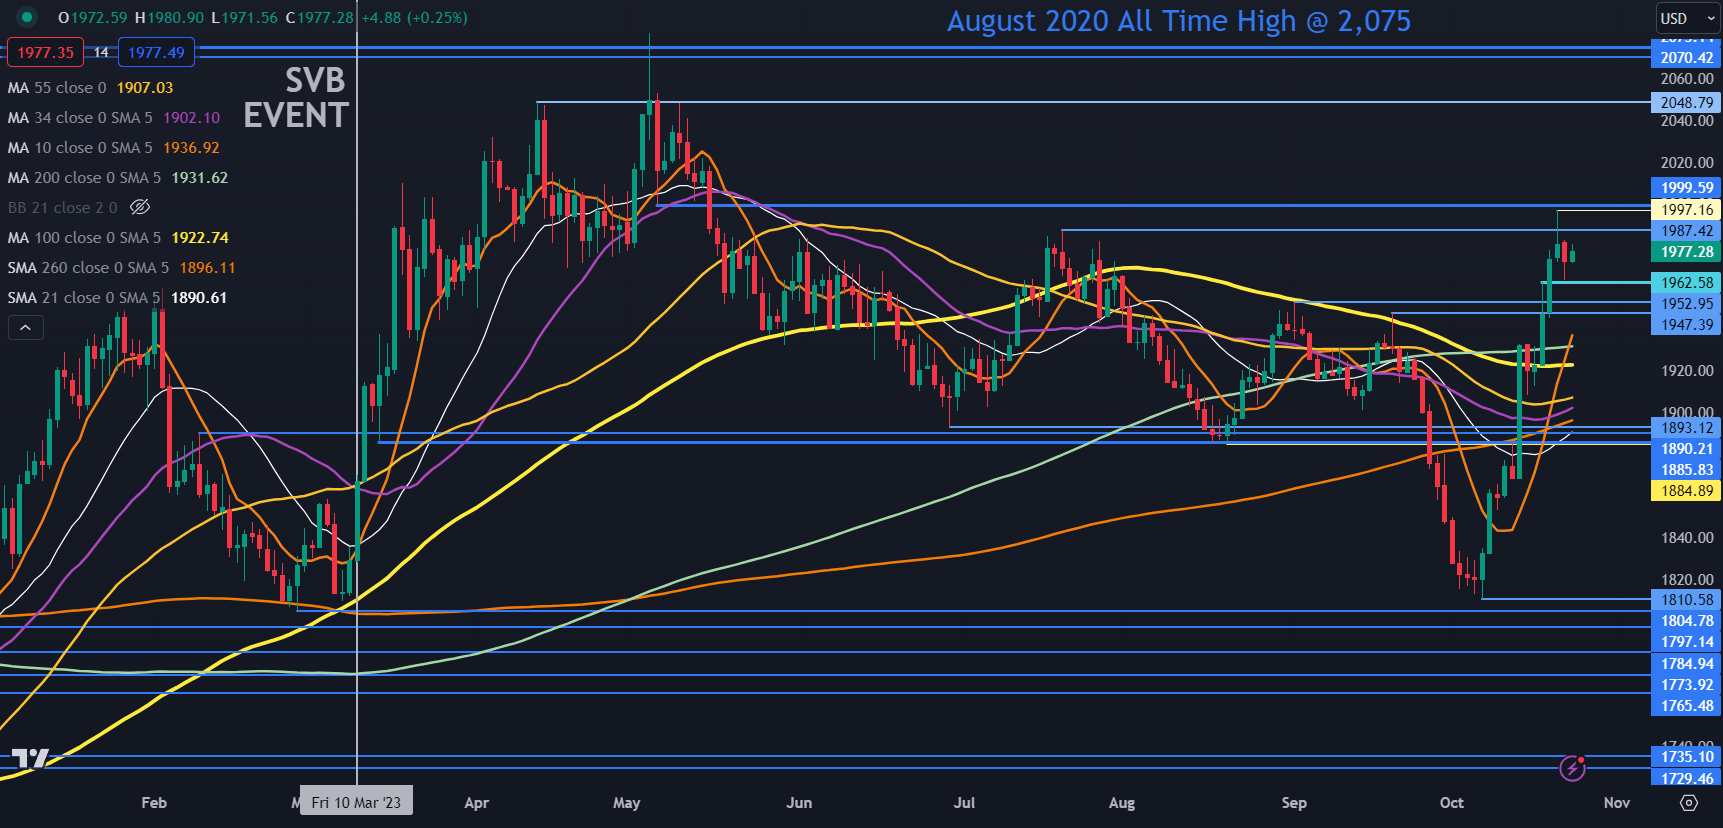
GOLD TECHNICAL ANALYSIS SNAPSHOT
The gold price rallied to within a whisker of breakpoint resistance last Friday but fell short of the psychological 2000 level.
Overnight, breakpoint support held near 1960 and these levels may continue to offer resistance and support respectively.
A feature of the chart below is the clustering of the 10-, 21-, 34-, 55-, 100-, 200- and 260-day Simple Moving Average (SMA). They all lie between 1890 and 1937.
This may suggest that mean reversion is possible and might allow range trading conditions to continue.
To learn more about range trading, click on the banner below.
Recommended by Daniel McCarthy
The Fundamentals of Range Trading
SPOT GOLD CHART
— Written by Daniel McCarthy, Strategist for DailyFX.com
Please contact Daniel via @DanMcCarthyFX on Twitter