FTSE 100, DAX 40, Dow Jones 30 Analysis and Charts
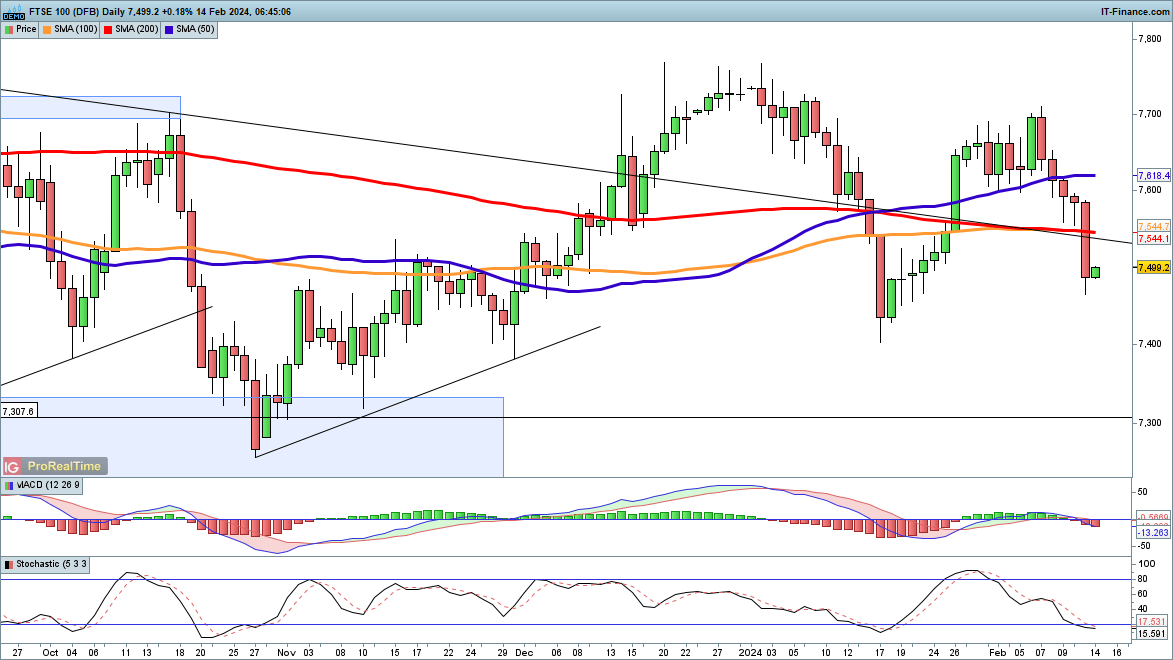
FTSE 100 recoups losses after UK CPI data
The index took a sharp drop on Tuesday in the wake of the US consumer price inflation (CPI) data.The price has now reversed course and sits at its lowest level since mid-January. It has also closed below trendline resistance from the 2023 highs. A move to 7400, the low from January, looks likely, and then beyond this comes the 7250 zone that was key support throughout 2023.
UK inflation data boosted the index thanks to sterling weakness, putting it on a stronger footing against other indices in early trading.
FTSE100 Daily Chart
Retail trader data shows 72.40% of traders are net-long the FTSE100 with the ratio of traders long to short at 2.62 to 1. The number of traders net long is 21.32% higher than yesterday and 93.96% higher than last week, while the number of traders net short is 25.71% lower than yesterday and 54.50% lower than last week.
See What This Means for Price Action:
| Change in | Longs | Shorts | OI |
| Daily | 38% | -31% | -8% |
| Weekly | -22% | 28% | -3% |
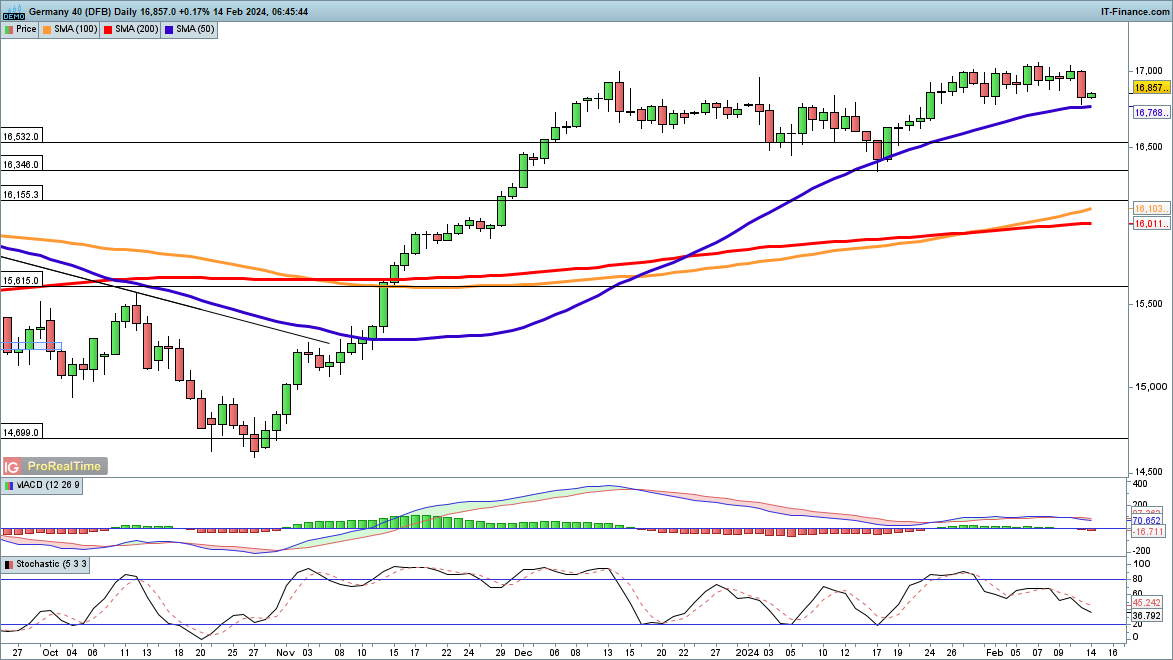
Dax slips back to 50-day moving average
The consolidation of the past three weeks gave way to losses on Tuesday, and a test of the 50-day simple moving average (SMA) seems likely.Below this comes 16,532, then down to 16,345, where the price found support earlier in 2024, and then from there the 16,155 level and 200-day SMA come into view.
The price remains close to its record high, and if the 50-day SMA holds we may yet see a bounce.
DAX 40 Daily Price
Trading is all about confidence – See our guide below
Recommended by Chris Beauchamp
Building Confidence in Trading
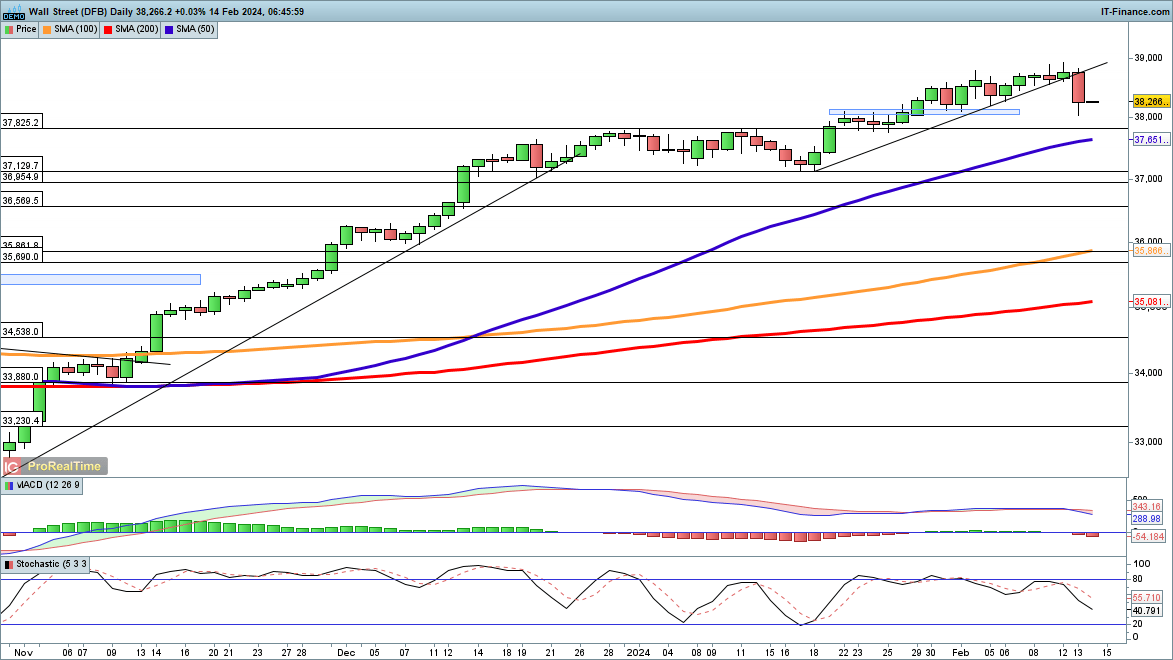
Dow heads lower after US inflation
The Dow briefly traded at its lowest level in more than two weeks following the hotter-than-expected US CPI report.The index has not suffered a serious retracement since the Q4 rally began in late October. A pullback from here targets the 50-day SMA, and then 37,129, where the price found support in early January.
A close back above 38,780 would suggest that the buyers have managed to reassert control.
Dow Jones Daily Chart