FTSE 100, DAX 40, S&P 500 Analysis and Charts
FTSE 100 little changed ahead of MPC member speech
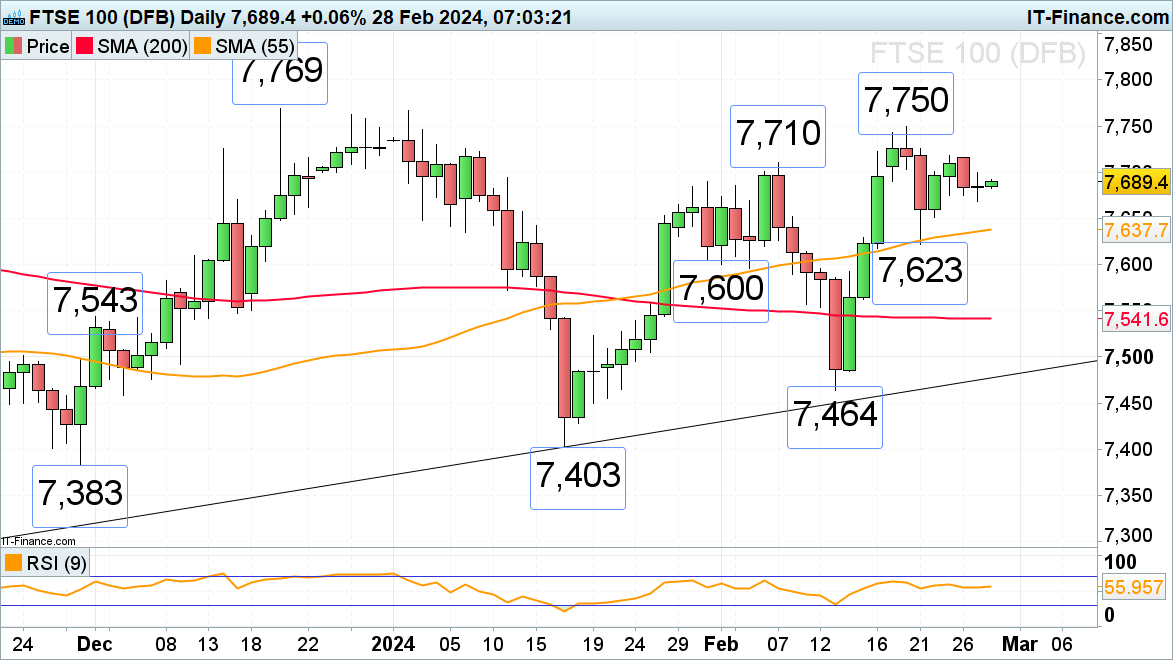
The FTSE 100’s recovery from last week’s 7,623 low amid strong earnings stalled at Friday’s 7,717 high while Tuesday’s low at 7,669 so far underpins ahead of today’s MPC member Mann speech. The 7,717 high needs to be exceeded for last week’s 7,750 six-week high to be back in focus. Further up lies the 7,769 December peak.
Minor support below Tuesday’s 7,669 low can be spotted at Friday’s 7,675 low ahead of the 55-day simple moving average (SMA) and last Wednesday’s low at 7,638 to 7,623.
FTSE 100 Daily Chart
Retail trader data shows 41.93% of traders are net-long with the ratio of traders short to long at 1.38 to 1. The number of traders net-long is 0.09% lower than yesterday and 18.34% higher than last week, while the number of traders net-short is 1.76% higher than yesterday and 22.87% lower than last week.
See what this means for the FTSE 100 Outlook
| Change in | Longs | Shorts | OI |
| Daily | 24% | -15% | 2% |
| Weekly | 4% | -17% | -7% |
DAX 40 once again trades at record highs
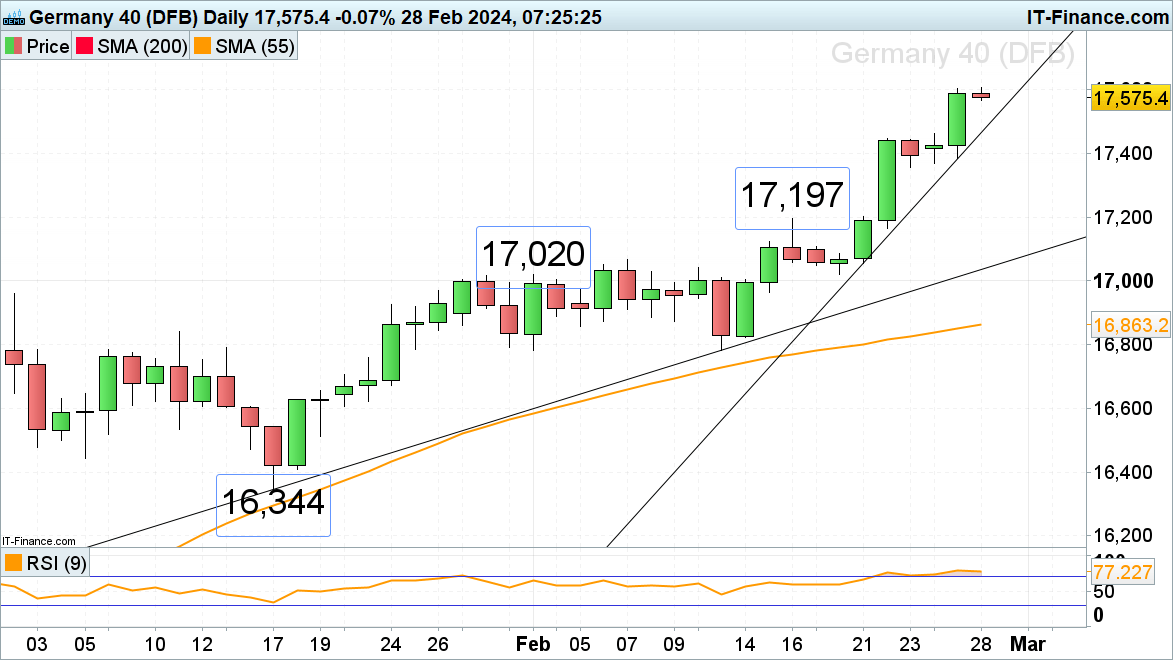
The DAX 40 index seems to be unstoppable as it rallies to yet another record high around the 17,600 mark as the latest earnings season highlighted that European stocks remain undervalued compared to their American counterparts with regards to Price-to-Earnings (PE) ratios. This has attracted further investment in Europe’s largest economy as Germany’s consumer morale also improves slightly.
Minor support is seen along the accelerated uptrend line at 17,464. Above the current record high at 17,607 lies the 18,000 region.
Dax 40 Daily Chart
Recommended by Axel Rudolph
The Fundamentals of Trend Trading
S&P 500 consolidates further below record highs
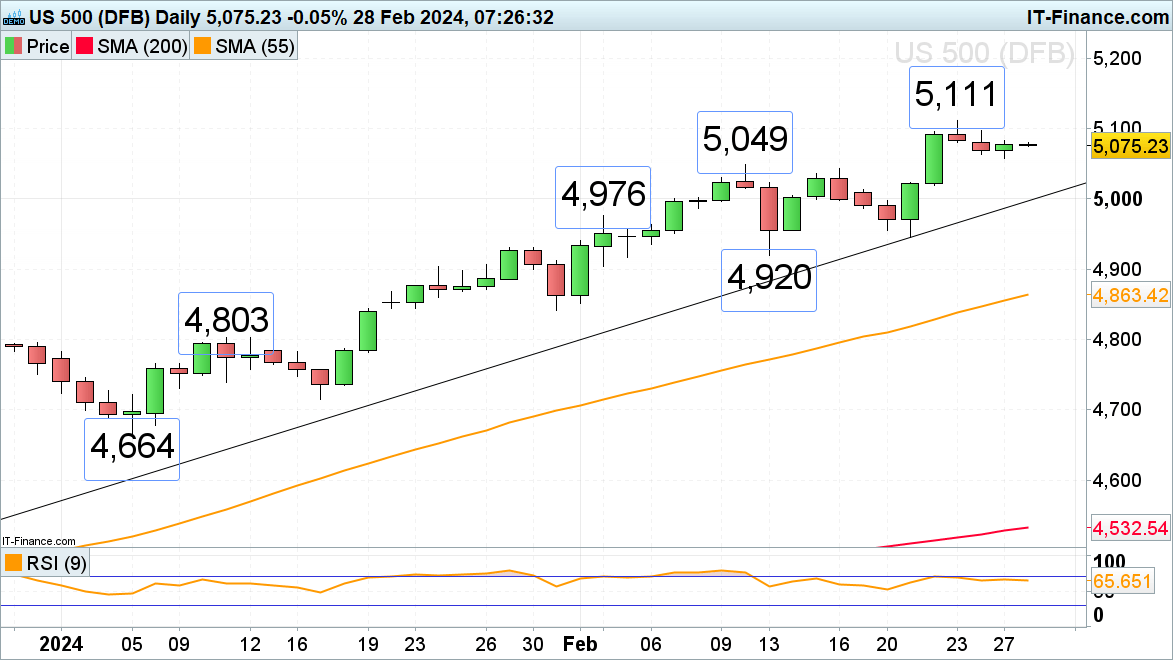
The S&P 500 continues to consolidate in low volatility above the psychological 5,000 mark, having come off its current February 5,111 record high made last week.
The index is thus treading water ahead of today’s second estimate of US Q4 GDP growth rate and Thursday’s PCE inflation data as well as speeches by FOMC members Bostic and Williams.
A fall through Tuesday’s 5,058 low would engage the 5,049 to 5,044 mid-February highs. While the 2024 uptrend line at 4,996 underpins, overall upside pressure should be maintained but the recent high at 5,111 may thwart future attempts of a new all-time high being seen. If overcome, however, the 5,200 region would be next in line.
S&P 500 Daily Chart