US DOLLAR FORECAST – EUR/USD, GBP/USD, USD/JPY
- U.S. dollar loses ground on Monday ahead of high-impact events later in the week
- Core PCE data and Powell’s speech on Friday will be the center of attention
- This article examines the technical outlook for EUR/USD, GBP/USD and USD/JPY
Most Read: US Dollar Forecast: PCE Data to Steal Show; EUR/USD, USD/JPY, GBP/USD Setups
The dollar fell slightly on Monday, but losses were moderate and probably contained by rallying U.S. Treasury yields. Many traders decided to take profits after the greenback’s strong performance last week, while others avoided taking large directional positions in anticipation of high-impact events in the coming days, including the release of core PCE data and a speech by Powell – both on Friday.
KEY UPCOMING EVENTS ON THE US ECONOMIC CALENDAR
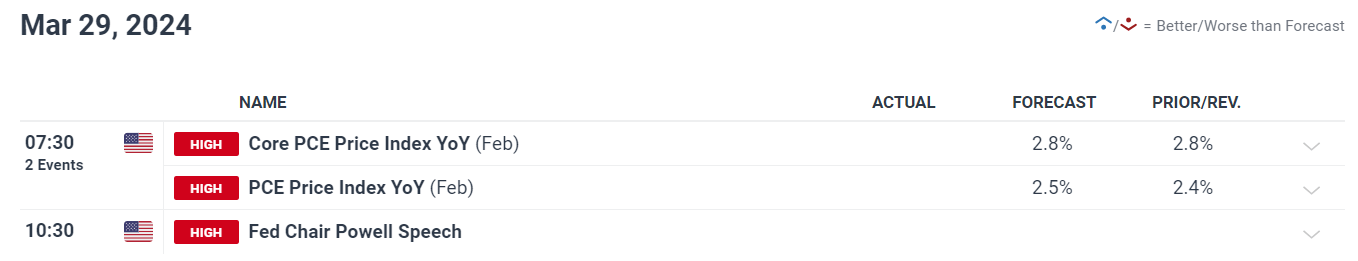
Source: DailyFX Economic Calendar
Shifting our focus from fundamentals to technical analysis, the next section of this article will examine market sentiment and price action dynamics for three major U.S. dollar pairs: EUR/USD, GBP/USD and USD/JPY. In this segment, we’ll identify critical levels of support and resistance that are essential for effective risk management when building positions.
Curious about the euro’s near-term prospects? Explore all the insights available in our quarterly forecast. Request your complimentary guide today!
Recommended by Diego Colman
Get Your Free EUR Forecast
EUR/USD FORECAST – TECHNICAL ANALYSIS
EUR/USD climbed on Monday after rebounding off technical support located around the 1.0800 area, with prices approaching confluence resistance at 1.0835-1.0850. Bulls must be resolute in defending this barrier; any lapse could pave the way for a move towards 1.0890, followed by 1.0925.
Conversely, in the event of sellers regaining dominance and triggering a pullback, support emerges at 1.0800, as stated previously. Maintaining this floor is essential to prevent a deterioration in euro sentiment; a breach may lead to a more significant decline towards 1.0725.
EUR/USD PRICE ACTION CHART
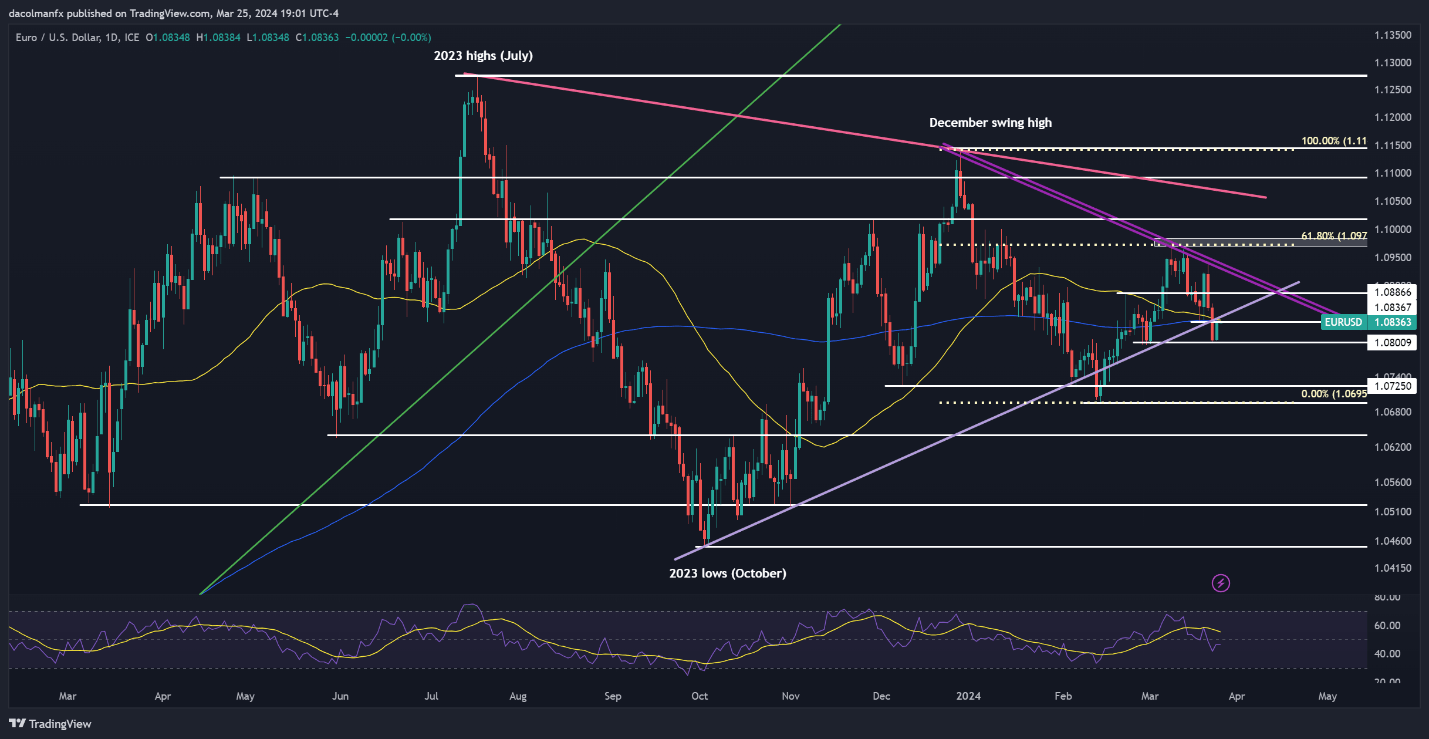
EUR/USD Chart Created Using TradingView
Want to stay ahead of the pound’s next major move? Access our quarterly forecast for comprehensive insights. Request your complimentary guide now to stay informed on market trends!
Recommended by Diego Colman
Get Your Free GBP Forecast
GBP/USD FORECAST – TECHNICAL ANALYSIS
After enduring a harsh selloff last week, GBP/USD found stability on Monday, with cable reclaiming some lost ground upon encountering support at its 200-day SMA near 1.2600. Should the rebound gather strength in the days ahead, resistance levels await at 1.2675, 1.2700, and 1.2830 subsequently.
On the flip side, if the market mood shifts back in favor of sellers and the exchange rate resumes its descent, support materializes at the psychological 1.2600 mark. Any additional losses beneath this technical zone could prompt a rapid decline towards 1.2510.
GBP/USD PRICE ACTION CHART
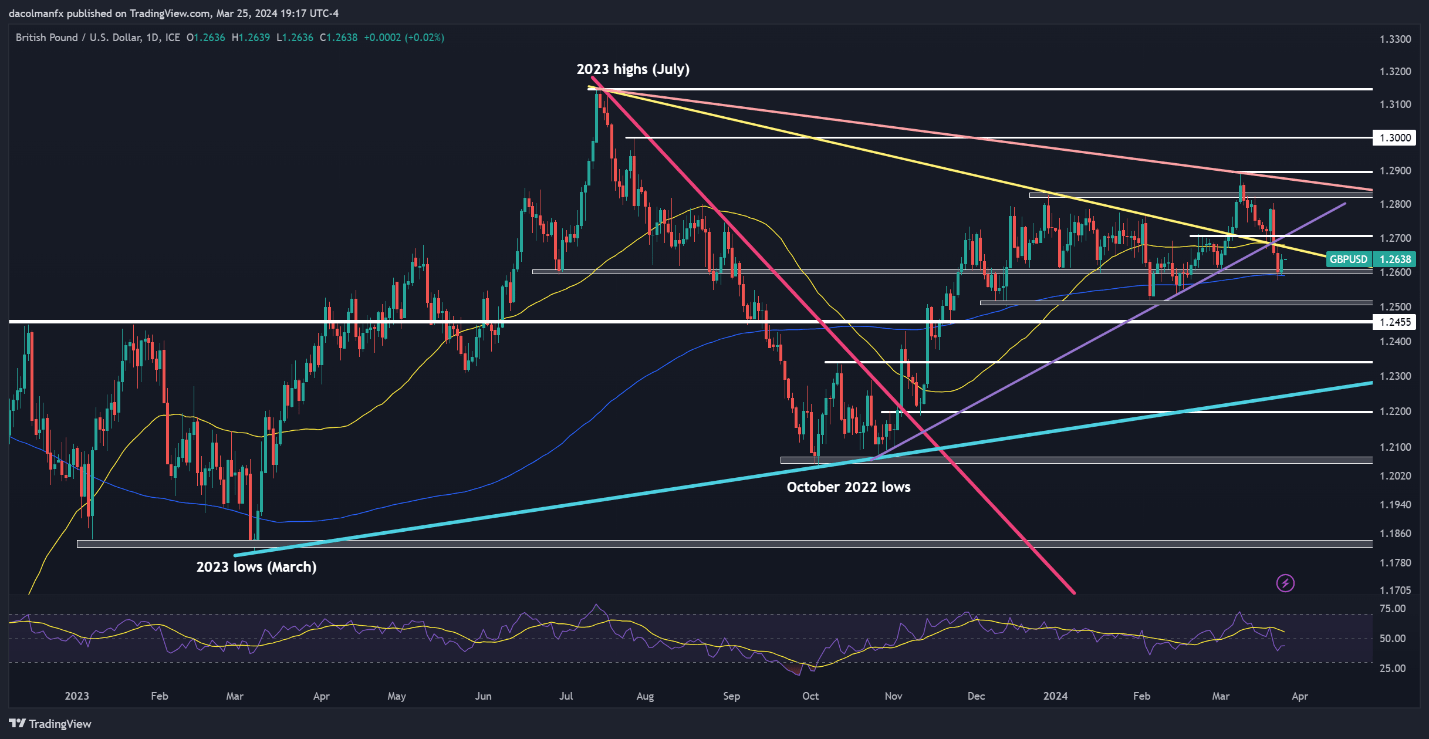
GBP/USD Chart Created Using TradingView
Eager to discover what the future holds for the Japanese yen? Delve into our quarterly forecast for expert insights. Get your free copy now!
Recommended by Diego Colman
Get Your Free JPY Forecast
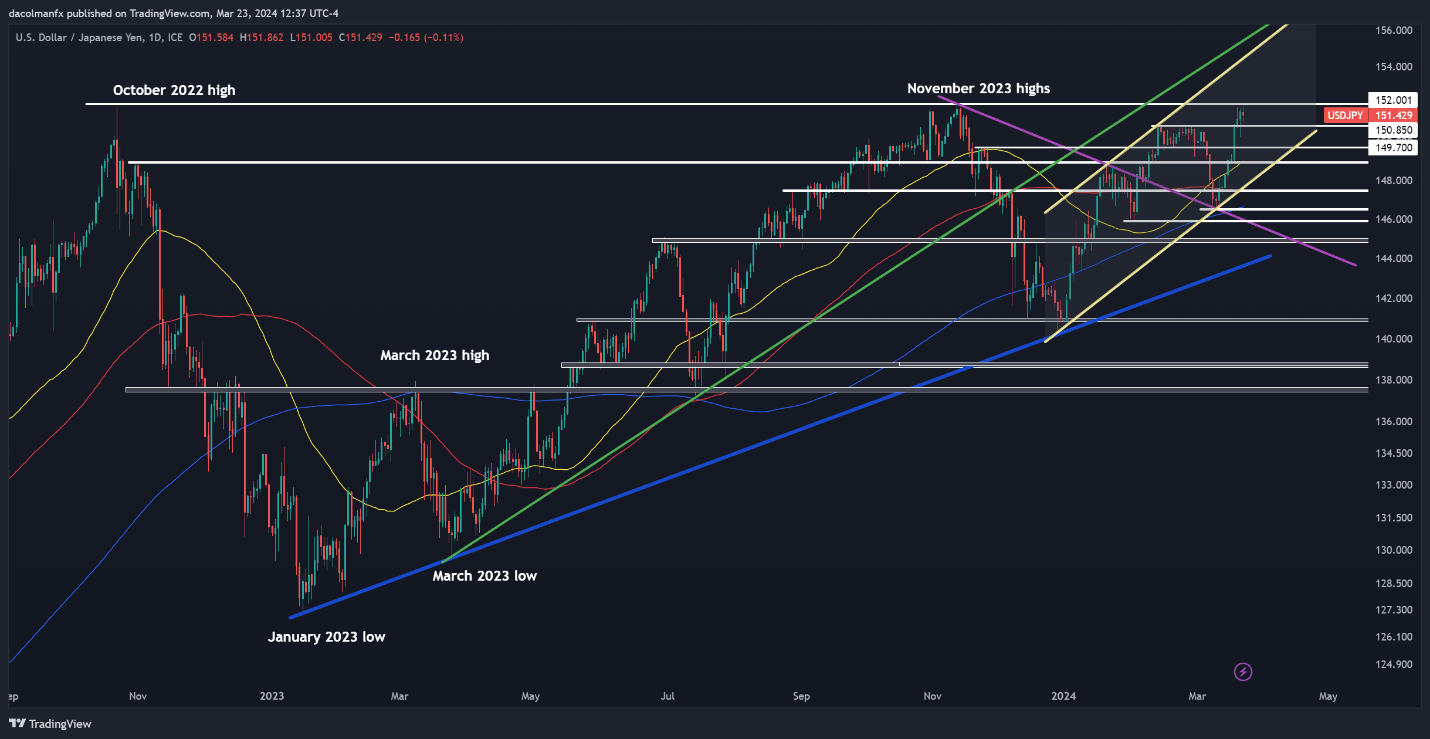
USD/JPY FORECAST – TECHNICAL ANALYSIS
USD/JPY showed no clear direction on Monday after last week’s surge, with the pair hovering just under last year’s peak at 152.00. A breach of this barrier might prompt Japanese authorities to intervene in support of the yen, potentially limiting the breakout’s longevity. Nevertheless, absent FX intervention, a surge beyond 152.00 could set the stage for a push towards 154.40.
Alternatively, if bears wrest control from bulls and initiate a reversal, support can be spotted at 150.90, followed by 149.75 subsequently. The pair might stabilize around these levels upon a retest, but if a breakdown occurs, a drop towards the 50-day simple moving average at 148.90 could be in the cards.
USD/JPY PRICE ACTION CHART