
Ethereum price struggled to rise above $2,550 and $2,580. ETH started a fresh decline like Bitcoin and traded below the $2,500 support zone.
- Ethereum attempted a fresh increase but failed to surpass $2,550.
- The price is trading below $2,500 and the 100-hourly Simple Moving Average.
- There is a connecting bearish trend line forming with resistance near $2,480 on the hourly chart of ETH/USD (data feed via Kraken).
- The pair continue to move down if there is a move below the $2,425 support.
Ethereum Price Extends Decline
Ethereum price struggled to gain pace for a move above the $2,550 and $2,580 resistance levels. ETH formed a short-term top and started a fresh decline below $2,500 like Bitcoin.
There was a move below the $2,450 level. A new weekly low was formed near $2,424 and the price is now consolidating losses. There was a minor increase above the $2,450 level, but the bears were active near the 23.6% Fib retracement level of the downward move from the $2,614 swing high to the $2,424 low.
Ethereum is now trading below $2,500 and the 100-hourly Simple Moving Average. On the upside, the price is facing resistance near the $2,465 level. The next hurdle could be $2,480. There is also a connecting bearish trend line forming with resistance near $2,480 on the hourly chart of ETH/USD.
The next major resistance is now near $2,520. A clear move above the $2,520 level might start a decent increase. In the stated case, the price could rise toward the $2,580 level.
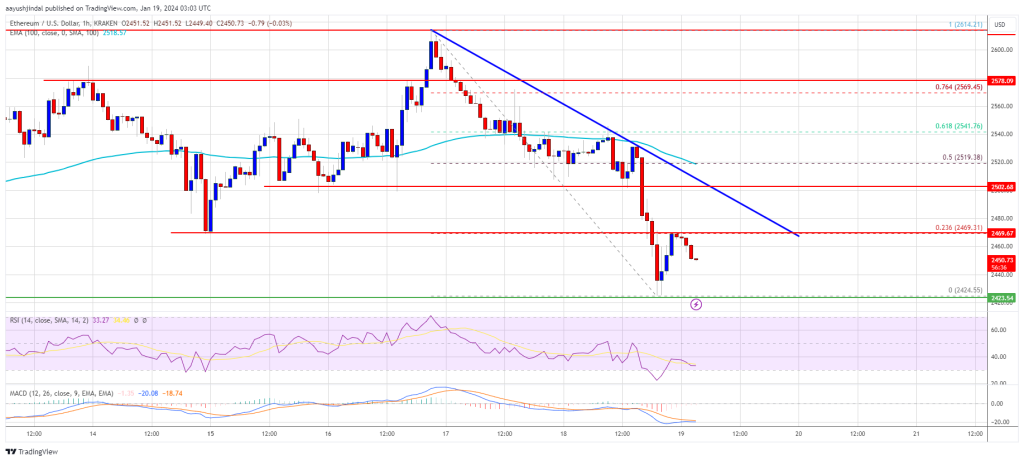
Source: ETHUSD on TradingView.com
The next key hurdle sits near the $2,620 zone. A close above the $2,620 resistance could start another steady increase. The next key resistance is near $2,680. Any more gains might send the price toward the $2,720 zone.
More Losses in ETH?
If Ethereum fails to clear the $2,520 resistance, it could start another decline. Initial support on the downside is near the $2,440 level.
The next key support could be the $2,425 zone. A downside break below the $2,425 support might send the price further lower. In the stated case, Ether could test the $2,350 support. Any more losses might send the price toward the $2,320 level.
Technical Indicators
Hourly MACD – The MACD for ETH/USD is gaining momentum in the bearish zone.
Hourly RSI – The RSI for ETH/USD is now below the 50 level.
Major Support Level – $2,425
Major Resistance Level – $2,520
Disclaimer: The article is provided for educational purposes only. It does not represent the opinions of NewsBTC on whether to buy, sell or hold any investments and naturally investing carries risks. You are advised to conduct your own research before making any investment decisions. Use information provided on this website entirely at your own risk.