
Ethereum price is attempting a recovery wave above the $2,200 zone. ETH could start a decent increase if it settles above the $2,240 resistance.
- Ethereum started an upside correction from the $2,165 zone.
- The price is trading below $2,250 and the 100-hourly Simple Moving Average.
- There is a short-term bearish trend line forming with resistance near $2,225 on the hourly chart of ETH/USD (data feed via Kraken).
- The pair might start a decent increase if it clears the $2,240 resistance zone.
Ethereum Price Eyes Recovery
Ethereum price managed to form a support base above the $2,165 level. ETH seems to be consolidating losses near the $2,200 level and might aim for a recovery wave, like Bitcoin.
There was a minor upside correction above the $2,200 level, but the bears are still active near the $2,240 resistance zone. There is also a short-term bearish trend line forming with resistance near $2,225 on the hourly chart of ETH/USD.
Ethereum is now trading below $2,250 and the 100-hourly Simple Moving Average. On the upside, the first major resistance is near the $2,240 level. It is close to the 23.6% Fib retracement level of the key drop from the $2,480 swing high to the $2,165 low.
The next major resistance is near the $2,280 or the 100-hourly Simple Moving Average, above which the price might rise and test the 50% Fib retracement level of the key drop from the $2,480 swing high to the $2,165 low. If the bulls push the price above the $2,320 resistance, they could aim for $2,360.
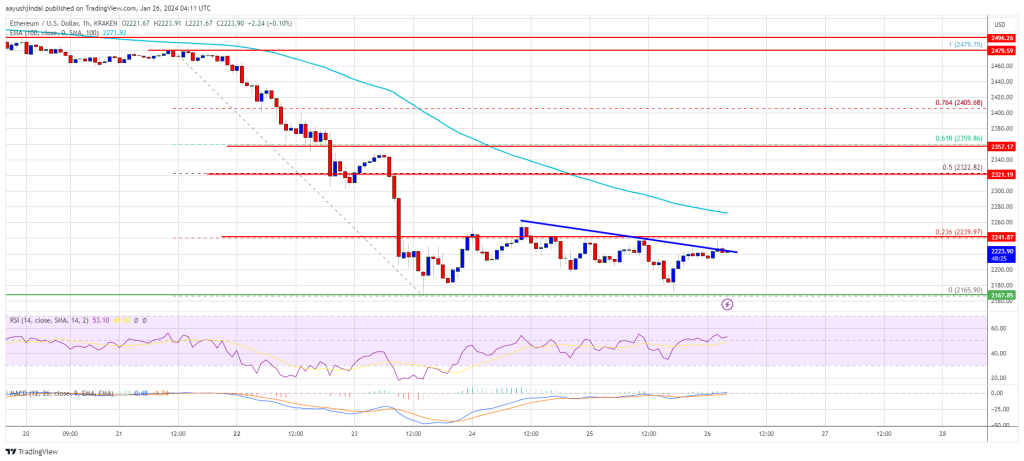
Source: ETHUSD on TradingView.com
A clear move above the $2,360 level might start a decent increase. In the stated case, the price could rise toward the $2,420 level. Any more gains might send the price toward the $2,500 zone.
Another Failure in ETH?
If Ethereum fails to clear the $2,240 resistance, it could start another decline. Initial support on the downside is near the $2,200 level.
The next key support could be the $2,165 zone. A daily close below the $2,165 support might start another major decline. In the stated case, Ether could test the $2,080 support. Any more losses might send the price toward the $2,000 level.
Technical Indicators
Hourly MACD – The MACD for ETH/USD is losing momentum in the bearish zone.
Hourly RSI – The RSI for ETH/USD is now above the 50 level.
Major Support Level – $2,165
Major Resistance Level – $2,240
Disclaimer: The article is provided for educational purposes only. It does not represent the opinions of NewsBTC on whether to buy, sell or hold any investments and naturally investing carries risks. You are advised to conduct your own research before making any investment decisions. Use information provided on this website entirely at your own risk.