
Dogecoin is showing bullish signs above the $0.0875 zone against the US Dollar. DOGE could extend its rally toward the $0.100 resistance in the near term.
- DOGE is showing positive signs above the $0.0875 zone against the US dollar.
- The price is trading above the $0.0880 level and the 100 simple moving average (4 hours).
- There was a break above a key contracting triangle with resistance at $0.0842 on the 4-hour chart of the DOGE/USD pair (data source from Kraken).
- The price could extend its rally above the $0.090 and $0.092 resistance levels.
Dogecoin Price Aims Higher
In the past few sessions, Dogecoin price started a decent increase from the $0.082 support zone. DOGE cleared many hurdles near $0.0850 to enter a positive zone.
There was a break above a key contracting triangle with resistance at $0.0842 on the 4-hour chart of the DOGE/USD pair. It even broke the $0.0880 resistance to move further into a positive zone like Bitcoin and Ethereum. A high was formed near $0.0914 and the price is now correcting gains.
There was a move below the 23.6% Fib retracement level of the recent wave from the $0.0820 swing low to the $0.0914 high. DOGE is also trading above the $0.0875 level and the 100 simple moving average (4 hours).
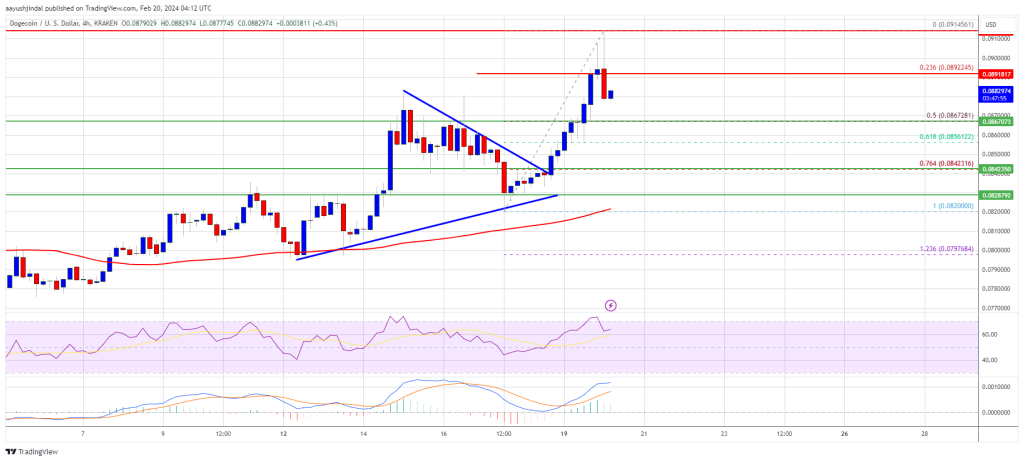
Source: DOGEUSD on TradingView.com
On the upside, the price is facing resistance near the $0.0892 level. The next major resistance is near the $0.0915 level. A close above the $0.0915 resistance might send the price toward the $0.095 resistance. The next major resistance is near $0.100. Any more gains might send the price toward the $0.120 level.
Downside Correction in DOGE?
If DOGE’s price fails to gain pace above the $0.0915 level, it could start a downside correction. Initial support on the downside is near the $0.0865 level.
The next major support is near the $0.0855 level or the 61.8% Fib retracement level of the recent wave from the $0.0820 swing low to the $0.0914 high. If there is a downside break below the $0.0855 support, the price could decline further. In the stated case, the price might decline toward the $0.0820 level.
Technical Indicators
4 Hours MACD – The MACD for DOGE/USD is now losing momentum in the bullish zone.
4 Hours RSI (Relative Strength Index) – The RSI for DOGE/USD is now above the 50 level.
Major Support Levels – $0.0865, $0.0855 and $0.0820.
Major Resistance Levels – $0.0915, $0.095, and $0.10.
Disclaimer: The article is provided for educational purposes only. It does not represent the opinions of NewsBTC on whether to buy, sell or hold any investments and naturally investing carries risks. You are advised to conduct your own research before making any investment decisions. Use information provided on this website entirely at your own risk.