
DAX 40, S&P 500, FTSE, 100 Analysis and Charts
Download our brand new Q2 Equities Forecast below
Recommended by Axel Rudolph
Get Your Free Equities Forecast
FTSE 100 comes off the 8,000 region
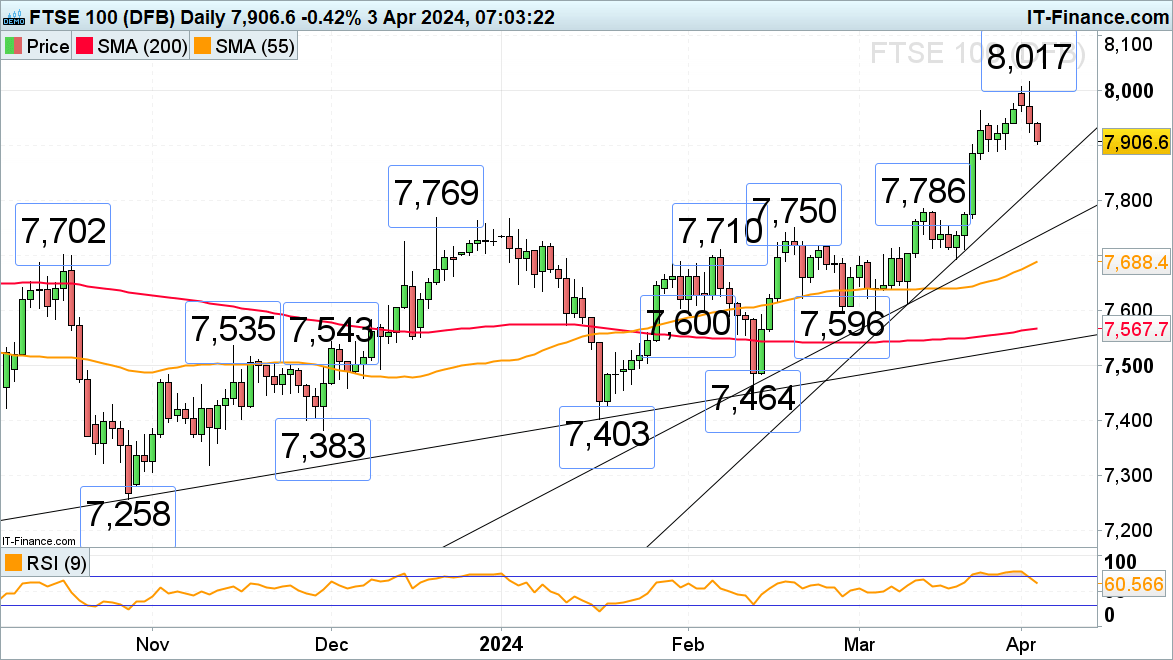
The FTSE 100’s rally to its 8,017 14-month high has been followed by a sharp sell-off as investors worry about inflation creeping back in, with the 7,889 late March low being in view. A fall through and daily chart close below this level would push the accelerated uptrend line at 7,831 to the fore. Below it lie the more significant December-to-mid-March highs at 7,786 to 7,747 which may act as support.
FTSE 100 Daily Chart
DAX 40 comes off yet another record high
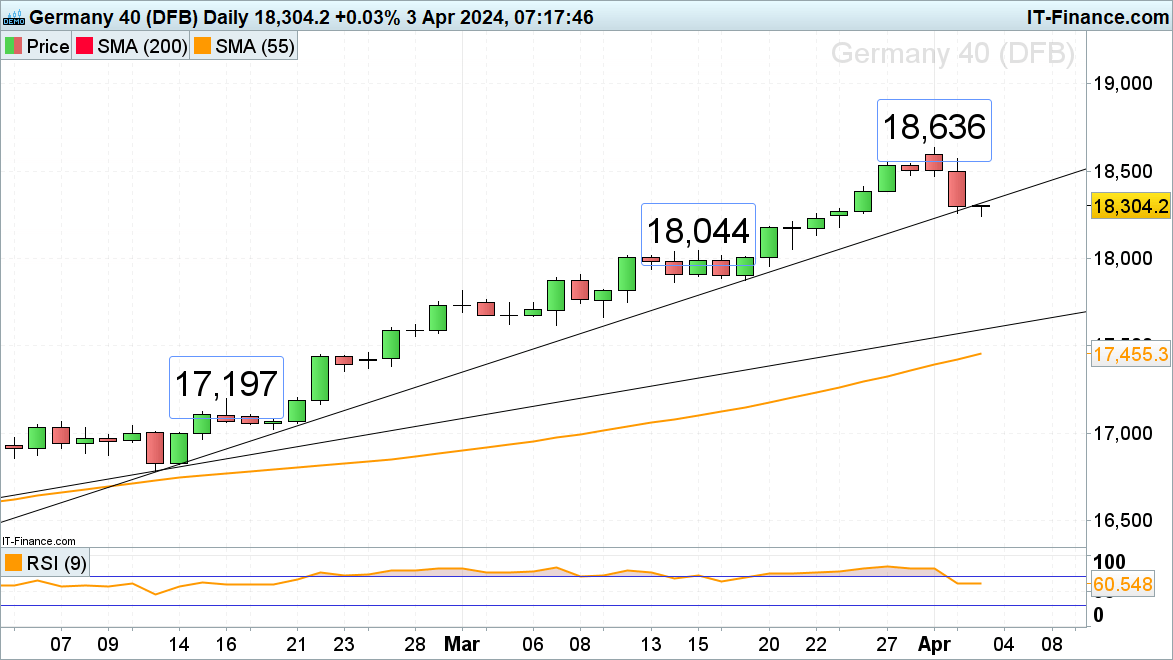
The DAX 40 reversed lower on Tuesday despite German inflation hitting a 3-year low and probed the February-to-March accelerated uptrend line at 18,274 which held. On Wednesday morning it was briefly slipped through before being revisited. Above it, minor resistance can be seen around the 27 March low at 18,382.
A fall through Wednesday’s 18,239 low would put the 18,044 mid-March high back on the cards.
DAX 40 Daily Chart
| Change in | Longs | Shorts | OI |
| Daily | 14% | -7% | -2% |
| Weekly | 20% | -18% | -11% |
S&P 500 comes off its record high
The S&P 500 reversed lower from this week’s record high, made at 5,274, amid strong US data which makes investors worry about the return of inflation and pares back rate cut expectations. The negative divergence on the daily Relative Strength Index (RSI) forewarned traders that a reversal may occur with the S&P 500 so far slipping to 5,184.
Short-term the breached October-to-April uptrend line, now a resistance line, at 5,225 may be revisited but a fall through 5,184 would put the early March highs at 5,165 to 5,150 on the map.