
Oil (Brent Crude, WTI) Analysis
- China adds further support to the ailing economy
- Brent crude oil drops at prior swing low, propped up by the 200 SMA
- WTI oil oscillates around key, long-term trend filter
- The analysis in this article makes use of chart patterns and key support and resistance levels. For more information visit our comprehensive education library
Recommended by Richard Snow
How to Trade Oil
China Adds Further Support to the Ailing Economy
In the early hours of Tuesday morning it was confirmed that the 5-year loan prime rate dropped by more than expected, in yet another show of support for not only the Chinese economy but for the real estate sector in particular.
Chinese economy is expected to grow by a meager 5% again this year with a number of concerns still lingering. The real estate sector appears void of confidence especially after a court order to liquidate the large developer Evergrande and while the rest of the world is battling inflation, China is dealing with the threat of deflation – lower prices year on year.
Nevertheless, the added support did little for oil markets as prices head lower. Concerns around global economic growth persist and China is a major contributor to oil demand growth. If doubts around china’s economic recovery persist, this could be seen in a lower oil price.
Brent crude oil drops at prior swing low, propped up by the 200 SMA
Crude oil prices have put in a phenomenal recovery, rising over 9% from the early February swing low. Price action appears to have found resistance at the $83.50 mark where prices have since turned lower towards the $82 mark. Cross section may be supported here given that the $82 mark it’s followed very closely by the 200 day simple moving average, meaning continued bearish momentum below the long term trend filter will be required to avoid a period of sideways trading.
The zone highlighted in purple corresponds to the fortunes of the local Chinese stock market, which sold off aggressively but has since stabilized on the back of state linked investment institutions buying up shares and ETFs in large quantities to restore confidence in the market.
$83.50 remains as immediate resistance with the RSI turning lower before reaching overbought levels. Immediate support is at $82.00 followed by the 200 SMA.
Brent Crude Oil (UK Oil) Daily Chart
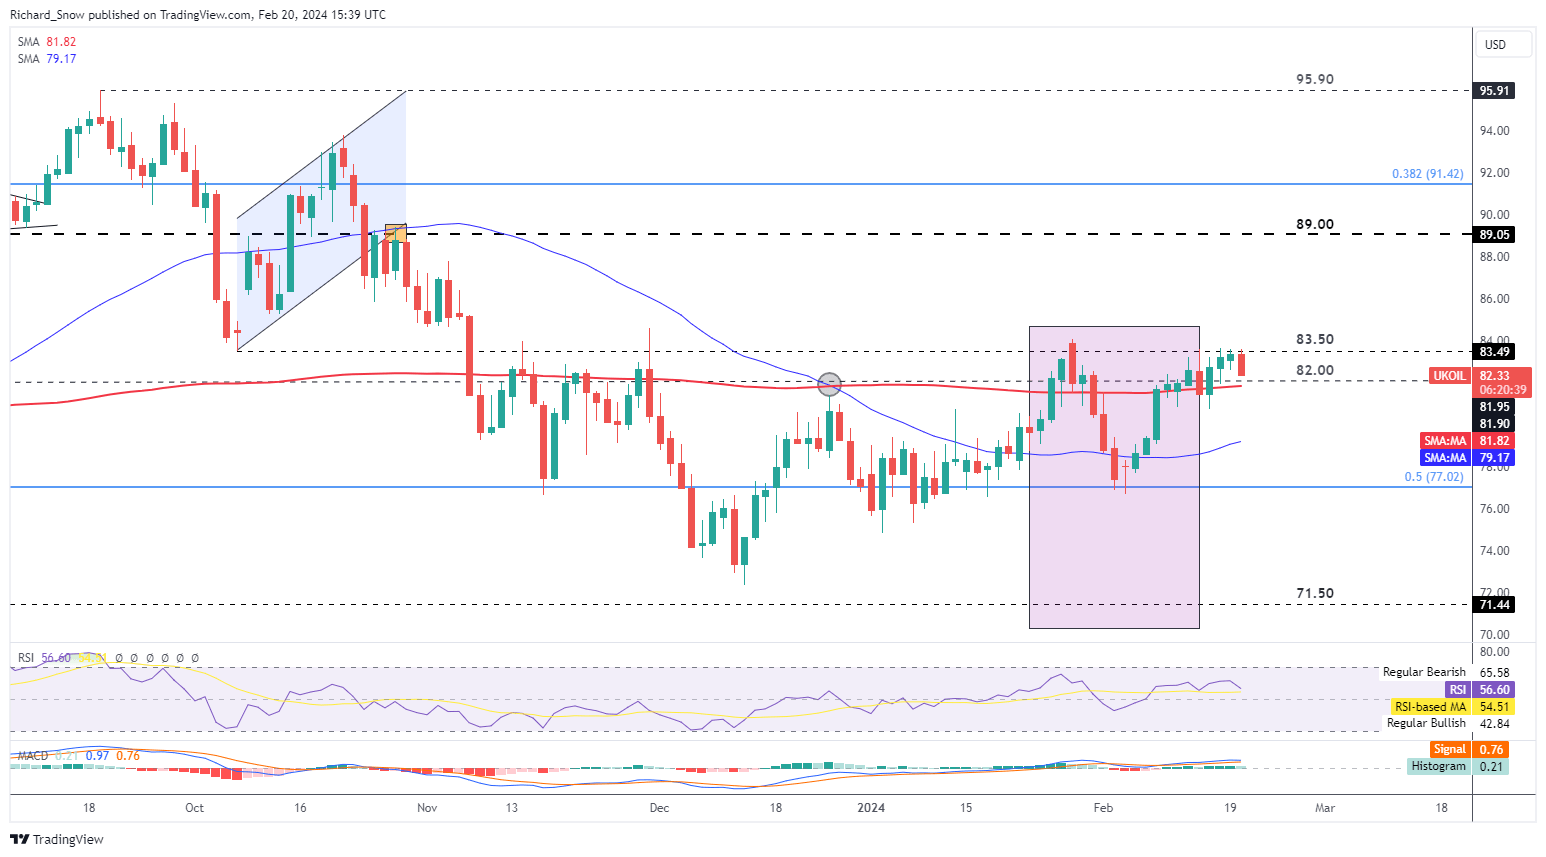
Source: TradingView, prepared by Richard Snow
Oil is a market inextricably linked to market forces of demand and supply but also responds to geopolitical tensions and severe weather events. Discover the fundamentals in our dedicated guide below:
Recommended by Richard Snow
Understanding the Core Fundamentals of Oil Trading
WTI oil oscillates around key long-term trend filter
WTI Crude oil it’s lower on Tuesday and tests a very key level comprised of the 200 day simple moving average and the long-term level of significance at $77.40. Over the more medium term price action trades higher, within an ascending channel marking a series of higher highs and higher lows.
Should we see further bearish momentum from here oil prices may look to test the 50 day simple moving average down at the $73.84 mark before potentially making another test of channel support. Oil prices continue to react to global growth prospects which appear to have worsened given that the UK and Japan have already confirmed recessions. In addition, Europe’s largest economy, Germany, is said to already be in recession according to the Bundesbank.
WTI Crude Daily Chart
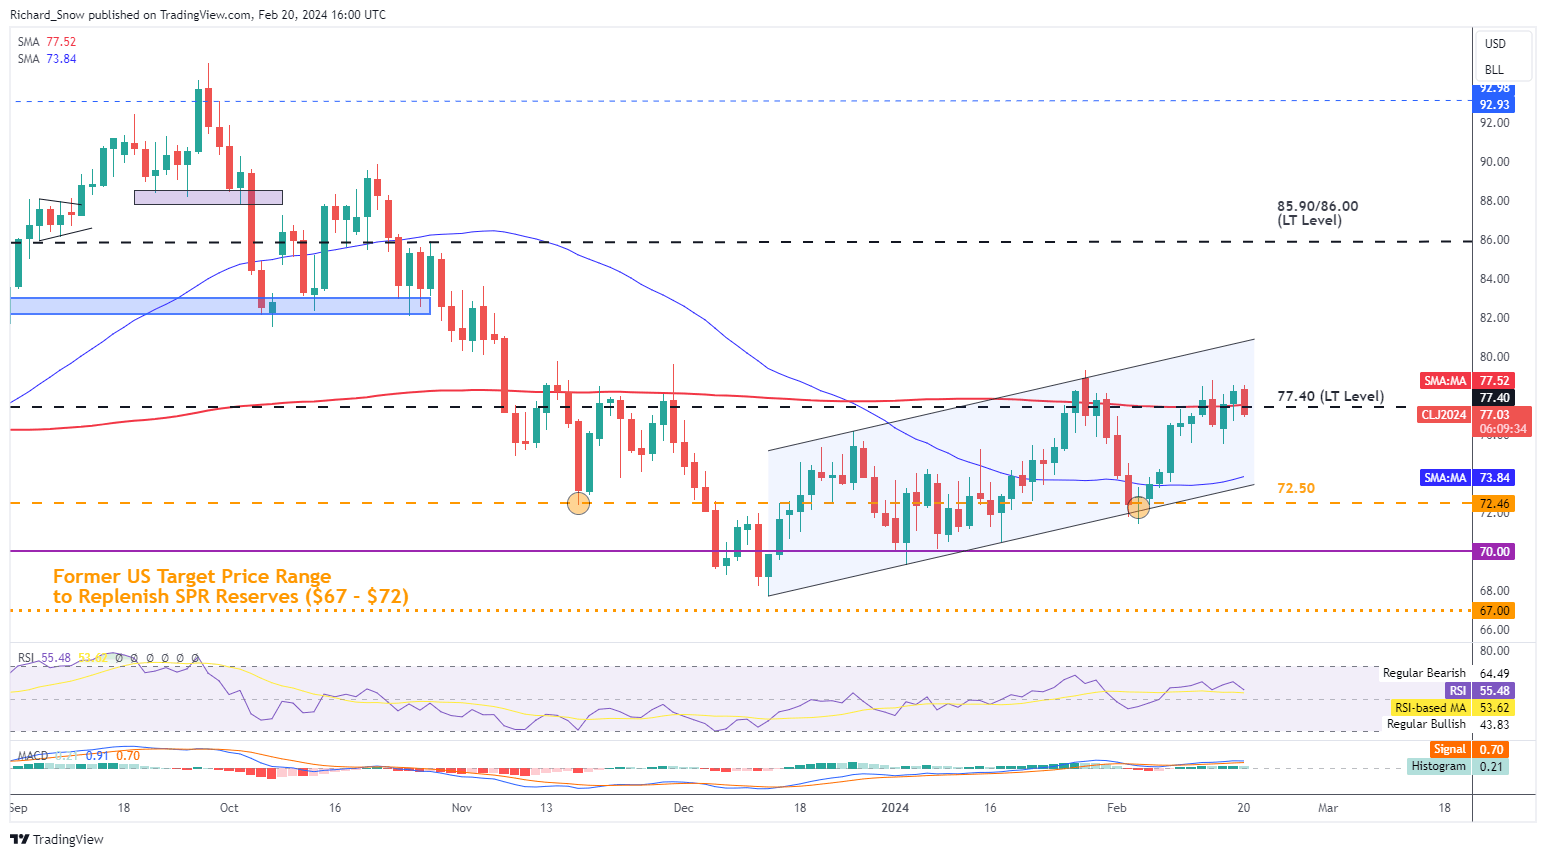
Source: TradingView, prepared by Richard Snow
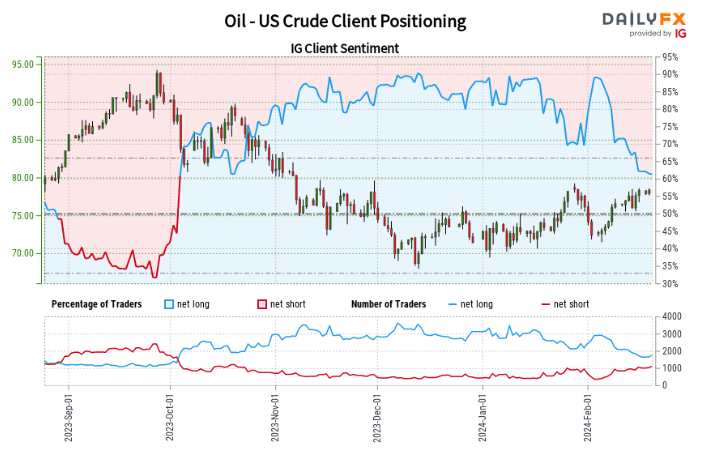
IG Client Sentiment Reveals Narrowing of Shorts and Longs, Distorting Signals
| Change in | Longs | Shorts | OI |
| Daily | -5% | 9% | 0% |
| Weekly | -1% | -1% | -1% |
Oil– US Crude:Retail trader data shows 63.69% of traders are net-long with the ratio of traders long to short at 1.75 to 1.
We typically take a contrarian view to crowd sentiment, and the fact traders are net-long suggestsOil– US Crude prices may continue to fall.
Positioning is more net-long than yesterday but less net-long from last week. The combination of current sentiment and recent changes gives us a further mixed Oil – US Crude trading bias.
— Written by Richard Snow for DailyFX.com
Contact and follow Richard on Twitter: @RichardSnowFX