
BNB price is gaining bullish momentum above the $450 resistance. The price is signaling a strong uptrend and might soon surpass the $500 resistance.
- BNB price is showing bullish signs above the $450 resistance level.
- The price is now trading above $465 and the 100 simple moving average (4 hours).
- There was a break above a connecting trend line with resistance at $430 on the 4-hour chart of the BNB/USD pair (data source from Binance).
- The pair could continue to rise toward the $500 resistance zone or even $520.
BNB Price Extends Rally
In the last BNB price prediction, we discussed the chances of more gains above the $400 resistance zone. The bulls did remain active and were able to push the price above the $400 level.
BNB is now outperforming Bitcoin and Ethereum with a move above the $450 resistance. There was a break above a connecting trend line with resistance at $430 on the 4-hour chart of the BNB/USD pair. It is up over 10% today and trading above $470.
A high was formed near $478 and the price is now consolidating gains. It is trading above the 23.6% Fib retracement level of the upward move from the $364 swing low to the $478 high.
The price is now trading above $465 and the 100 simple moving average (4 hours). Immediate resistance is near the $475 level. The next resistance sits near the $488 level. A clear move above the $488 zone could send the price further higher.
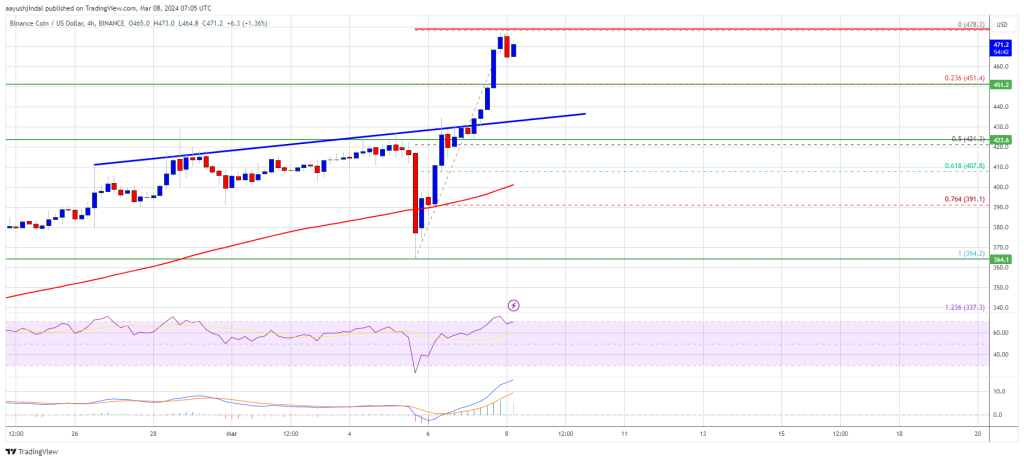
Source: BNBUSD on TradingView.com
In the stated case, BNB price could test $500. A close above the $500 resistance might set the pace for a larger increase toward the $520 resistance. Any more gains might call for a test of the $542 level in the coming days.
Dips Supported?
If BNB fails to clear the $475 resistance, it could start a downside correction. Initial support on the downside is near the $4620 level.
The next major support is near the $450 level. The main support sits at $420 or the 50% Fib retracement level of the upward move from the $364 swing low to the $478 high. If there is a downside break below the $420 support, the price could drop toward the $400 support. Any more losses could initiate a larger decline toward the $380 level.
Technical Indicators
4-Hours MACD – The MACD for BNB/USD is gaining pace in the bullish zone.
4-Hours RSI (Relative Strength Index) – The RSI for BNB/USD is currently above the 50 level.
Major Support Levels – $460, $450, and $420.
Major Resistance Levels – $475, $500, and $520.
Disclaimer: The article is provided for educational purposes only. It does not represent the opinions of NewsBTC on whether to buy, sell or hold any investments and naturally investing carries risks. You are advised to conduct your own research before making any investment decisions. Use information provided on this website entirely at your own risk.