
Gold (XAU/USD) Price Analysis and Chart
- Gold readying for another shot at the December 4th spike high.
- Will Chair Powell give anything away later today?
Most Read: Silver Tumbles Back Into Multi-Month Support Zone
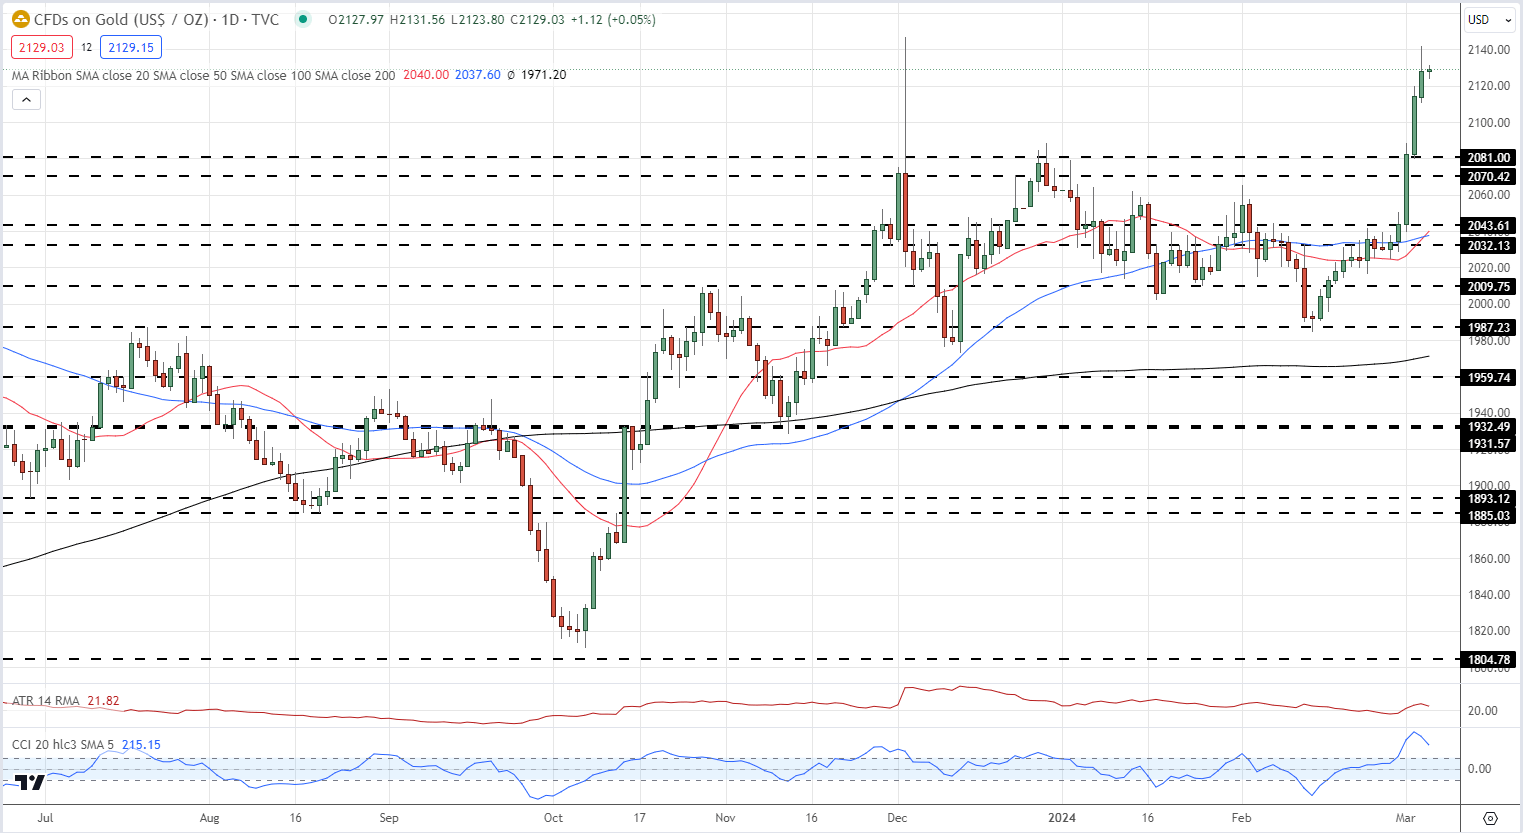
Gold’s recent rally accelerated last Friday, driven higher by weak US economic data, and the rally back towards a new all-time high has continued this week with the precious metal posting a $2,141.8/oz. peak yesterday. This left gold just $3 short of printing a new ATH. The technical outlook for gold remains positive and suggests that the precious metal will continue to move higher.
The drivers for the latest move higher in gold remain the same, the upcoming series of US interest rate cuts – three 25 basis point moves seen this year, starting at the June FOMC meeting – ongoing haven buying on geopolitical fears in Ukraine and the Middle East, and heavy central bank buying as bankers diversify away from the US dollar.
Later today, Fed Chair Jerome Powell will testify to the House Financial Services Committee (15:00 UK). Mr. Powell is not expected to lay out any timetable for interest rate cuts just yet, although any discussions about inflation, or the US labor market, will be keenly followed. The next FOMC meeting is on March 20th and this may be a more appropriate setting for official rate cut discussions.
For all market-moving economic data and events, see the DailyFX Economic Calendar.
Learn how to trade economic data and events with our complimentary guide
Recommended by Nick Cawley
Trading Forex News: The Strategy
The daily gold chart remains positive with a prior level of resistance at $2,081/oz. now turning into support. Before that, the $2,114/oz level may act as a buffer after closing there on Monday and opening there on Tuesday. The CCI indicator at the bottom of the chart does show gold to be extremely overbought although this reading is starting to move lower. There may be a short period of consolidation ahead but overall the path of least resistance for gold is higher.
Gold Daily Price Chart
Recommended by Nick Cawley
How to Trade Gold
Retail trader data show 44.00% of traders are net-long with the ratio of traders short to long at 1.27 to 1.The number of traders net-long is 3.42% higher than yesterday and 18.14% lower than last week, while the number of traders net-short is 5.01% higher than yesterday and 65.42% higher than last week.
We typically take a contrarian view to crowd sentiment, and the fact traders are net-short suggests Gold prices may continue to rise.
See what these swings in positioning mean for the price of gold
| Change in | Longs | Shorts | OI |
| Daily | -10% | -4% | -7% |
| Weekly | -4% | 23% | 10% |
What is your view on Gold – bullish or bearish?? You can let us know via the form at the end of this piece or you can contact the author via Twitter @nickcawley1.