
Number of traders net-short has increased by 21.83% from last week.
| SYMBOL | TRADING BIAS | NET-LONG% | NET-SHORT% | CHANGE IN LONGS | CHANGE IN SHORTS | CHANGE IN OI |
|---|---|---|---|---|---|---|
| FTSE 100 | BULLISH | 49.68% | 50.32% |
-16.94% Daily -21.91% Weekly |
23.33% Daily 21.83% Weekly |
-0.61% Daily -4.69% Weekly |
| Change in | Longs | Shorts | OI |
| Daily | 46% | -32% | -7% |
| Weekly | -24% | 43% | -1% |
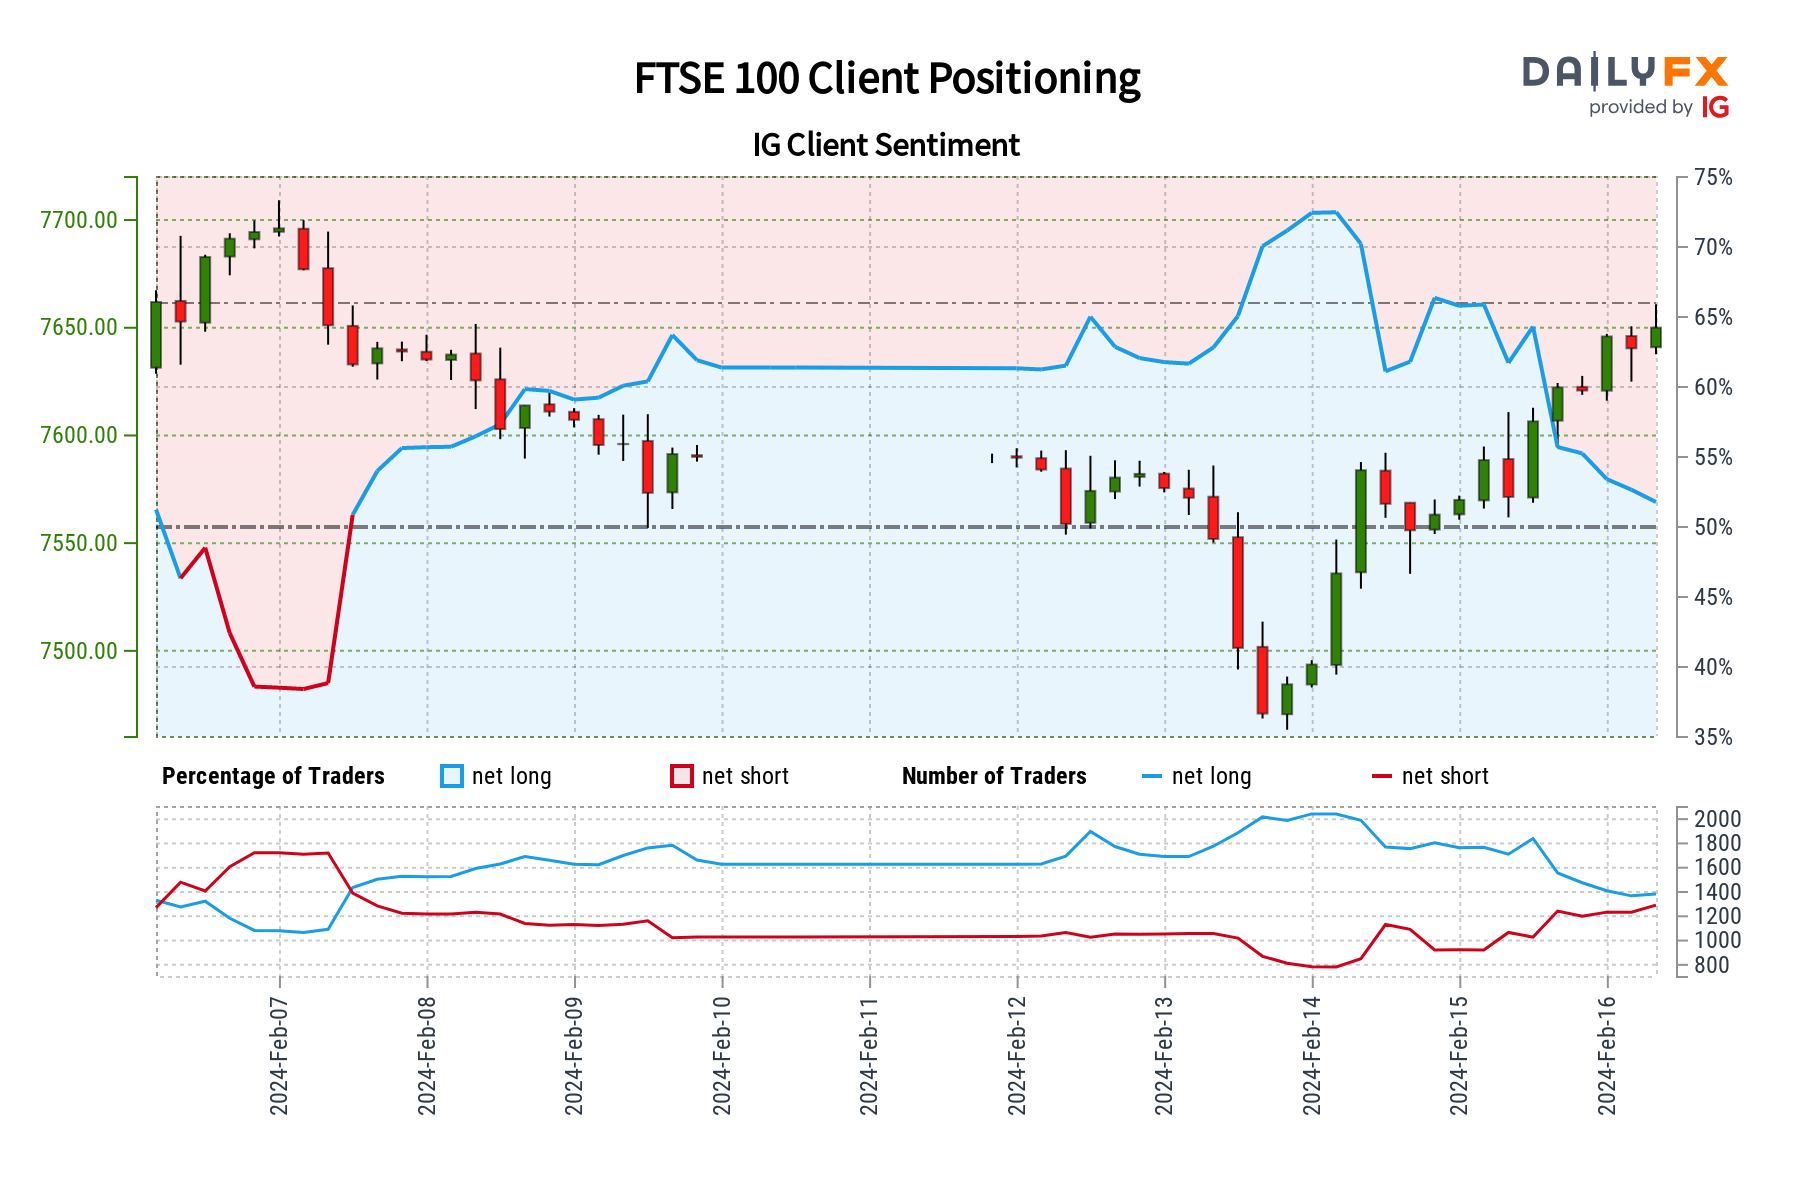
FTSE 100: Retail trader data shows 49.68% of traders are net-long with the ratio of traders short to long at 1.01 to 1. In fact, traders have remained net-short since Feb 07 when FTSE 100 traded near 7,638.50, price has moved 0.15% higher since then. The number of traders net-long is 16.94% lower than yesterday and 21.91% lower from last week, while the number of traders net-short is 23.33% higher than yesterday and 21.83% higher from last week.
We typically take a contrarian view to crowd sentiment, and the fact traders are net-short suggests FTSE 100 prices may continue to rise.
Our data shows traders are now net-short FTSE 100 for the first time since Feb 07, 2024 11:00 GMT when FTSE 100 traded near 7,638.50. Traders are further net-short than yesterday and last week, and the combination of current sentiment and recent changes gives us a stronger FTSE 100-bullish contrarian trading bias.