
XRP price is struggling to clear the $0.520 resistance. The price could gain bearish momentum if there is a close below the $0.4850 support.
- XRP is showing bearish signs below the $0.520 and $0.508 resistance levels.
- The price is now trading below $0.520 and the 100 simple moving average (4 hours).
- There is a connecting bearish trend line forming with resistance near $0.5120 on the 4-hour chart of the XRP/USD pair (data source from Kraken).
- The pair is now at risk of more downsides below the $0.5000 support zone.
XRP Price Faces Many Hurdles
In the past few days, XRP price saw a downside reaction below the $0.550 pivot level. The bears remained active and were able to push the price below the $0.500 support zone.
Recently, there was a recovery wave above the $0.500 level. The bulls pushed the price above the 50% Fib retracement level of the downward wave from the $0.5390 swing high to the $0.4850 low. However, the bears were active near the $0.525 resistance.
Ripple’s token failed to clear the 76.4% Fib retracement level of the downward wave from the $0.5390 swing high to the $0.4850 low. XRP is now trading in a bearish zone below $0.508 and the 100 simple moving average (4 hours), unlike Bitcoin and Ethereum.
On the upside, immediate resistance is near the $0.512 zone. There is also a connecting bearish trend line forming with resistance near $0.5120 on the 4-hour chart of the XRP/USD pair. The first key resistance is near $0.520, above which the price could rise toward the $0.5320 resistance.
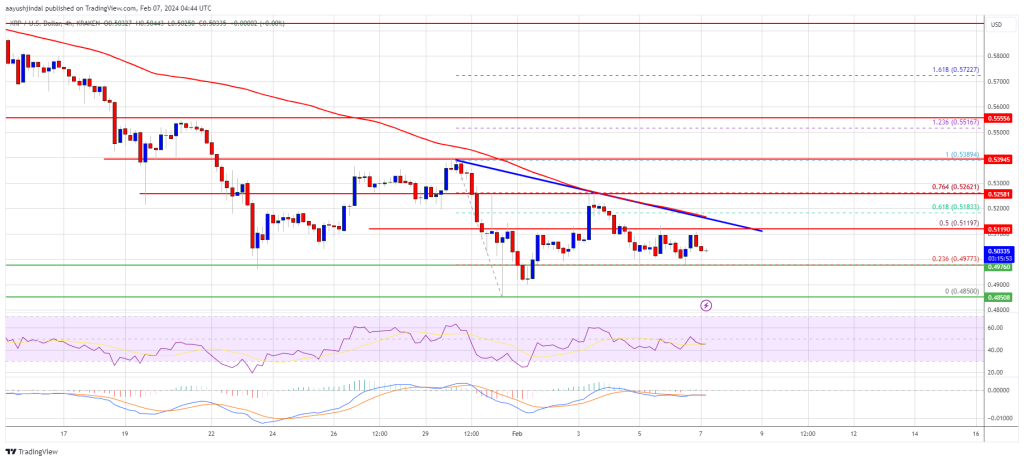
Source: XRPUSD on TradingView.com
A close above the $0.5320 resistance zone could spark a strong increase. The next key resistance is near $0.5550. If the bulls remain in action above the $0.5550 resistance level, there could be a rally toward the $0.5840 resistance. Any more gains might send the price toward the $0.6000 resistance.
More Downsides?
If XRP fails to clear the $0.5120 resistance zone, it could continue to move down. Initial support on the downside is near the $0.500 zone.
The next major support is at $0.485. If there is a downside break and a close below the $0.485 level, the price might accelerate lower. In the stated case, the price could retest the $0.450 support zone.
Technical Indicators
4-Hours MACD – The MACD for XRP/USD is now gaining pace in the bearish zone.
4-Hours RSI (Relative Strength Index) – The RSI for XRP/USD is now below the 50 level.
Major Support Levels – $0.500, $0.485, and $0.450.
Major Resistance Levels – $0.512, $0.520, and $0.532.
Disclaimer: The article is provided for educational purposes only. It does not represent the opinions of NewsBTC on whether to buy, sell or hold any investments and naturally investing carries risks. You are advised to conduct your own research before making any investment decisions. Use information provided on this website entirely at your own risk.