
USD Weekly Forecast: Bullish
- The dollar may find temporary support before the Fed builds its case for rate cuts
- Euro appears vulnerable heading into next week: EU and German GDP data due
- Cable (GBP/USD) range likely to be tested due to anticipated lift in volatility
- USD/JPY shows a sign of fatigue after the strong bull run
- Get your hands on the U.S. dollar Q1 outlook today for exclusive insights into key market catalysts that should be on every trader’s radar:
Recommended by Richard Snow
Get Your Free USD Forecast
The Dollar May Find Temporary Support Before the Fed Builds its Case for Rate Cuts
In the days and weeks leading up the next week’s FOMC meeting, prominent Fed members warned that overzealous expectations around future rate cuts were too optimistic and that the Fed does not intend to cut the benchmark rate as quickly as markets anticipated.
The chart below shows how future rate expectations for all 2024 Fed funds futures contracts have been tapered back since. The coloured lines have moved higher, signalling a reduced probability of rate cuts across the board since the end of last year. Reduced rate cut odds support the dollar, but the bar for an extended bullish move is very high.
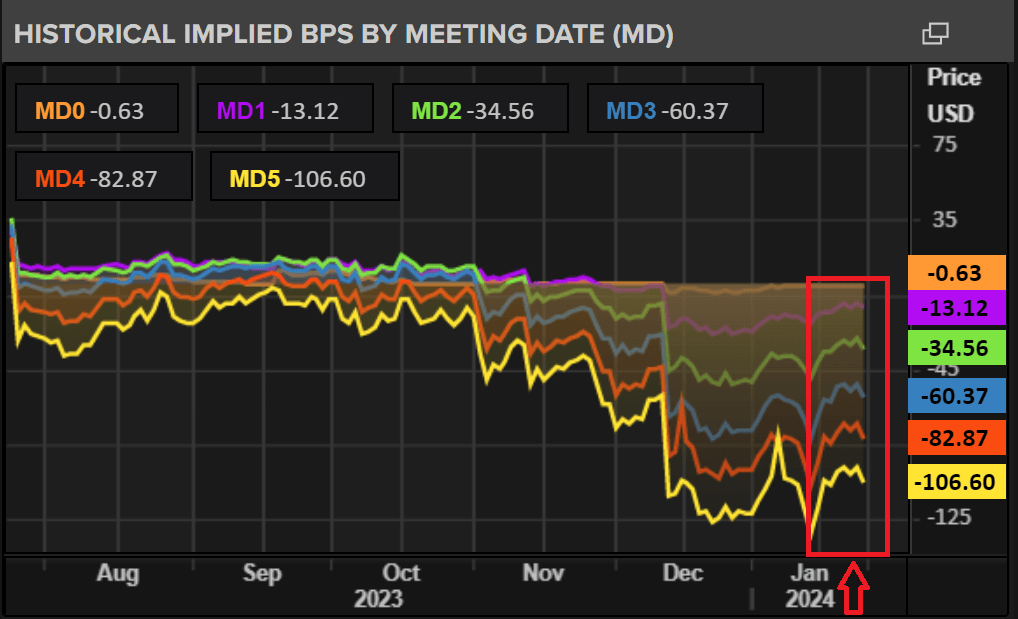
Source: Refinitiv, prepared by Richard Snow
Accompanying data has helped drive the Fed’s message home as hotter than expected December CPI revealed lingering price pressures, although a lot of that was influenced by base effects which are mostly behind us now.
Additionally, January’s flash PMI data was strong as was the Q4 GDP print despite falling from the 4.9% growth in Q3. Equity markets soar and the unemployment rate is well below 4% now, meaning the ‘soft landing’ or ‘golden path’ gains favour once again. If the Fed sees upside risks to services inflation as a result of the strong data, it will continue to proceed with caution but the statement in general is expected to move towards a more neutral tone which we could see as early as next week.
Moving from rate hikes to rate cuts is a lot like trying to turn around a massive freight ship. You first have to reduce speed, then turn before proceeding in the opposite direction. I anticipate we’ll see more of a reduction in speed next week. The chart below shows the duration between the last rate hike and first rate cut since the 1970s. Interestingly, the average of these plateaus can be rounded up to 6 months. Today marks exactly 6 months since the Fed last hiked the Fed funds rate.
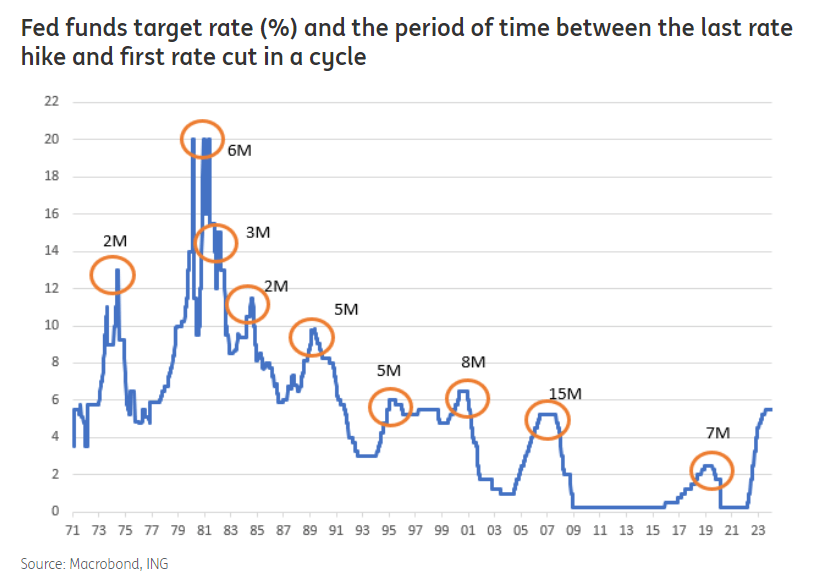
Source: ING, Macrobond, prepared by Richard Snow
Euro Appears Vulnerable Heading into Next Week
The EU has received lacklustre economic data recently and even sentiment indicators have lost a bit of the recent momentum. PMI data continued to contract while positive developments were seen in the US. Next week, EU and German GDP data could finally confirm a technical recession, but based off comments from ECB members today, it would appear stagnation is seen as more realistic than a recession. That is according to the ECB’s Vujcic.
Recommended by Richard Snow
How to Trade EUR/USD
The weekly EUR/USD chart is on track for a second weekly close lower, extending the downtrend since the late December swing high. This week’s high failed to close above 1.0929, seeing the pair on track to close in the red.
EUR/USD Weekly Chart
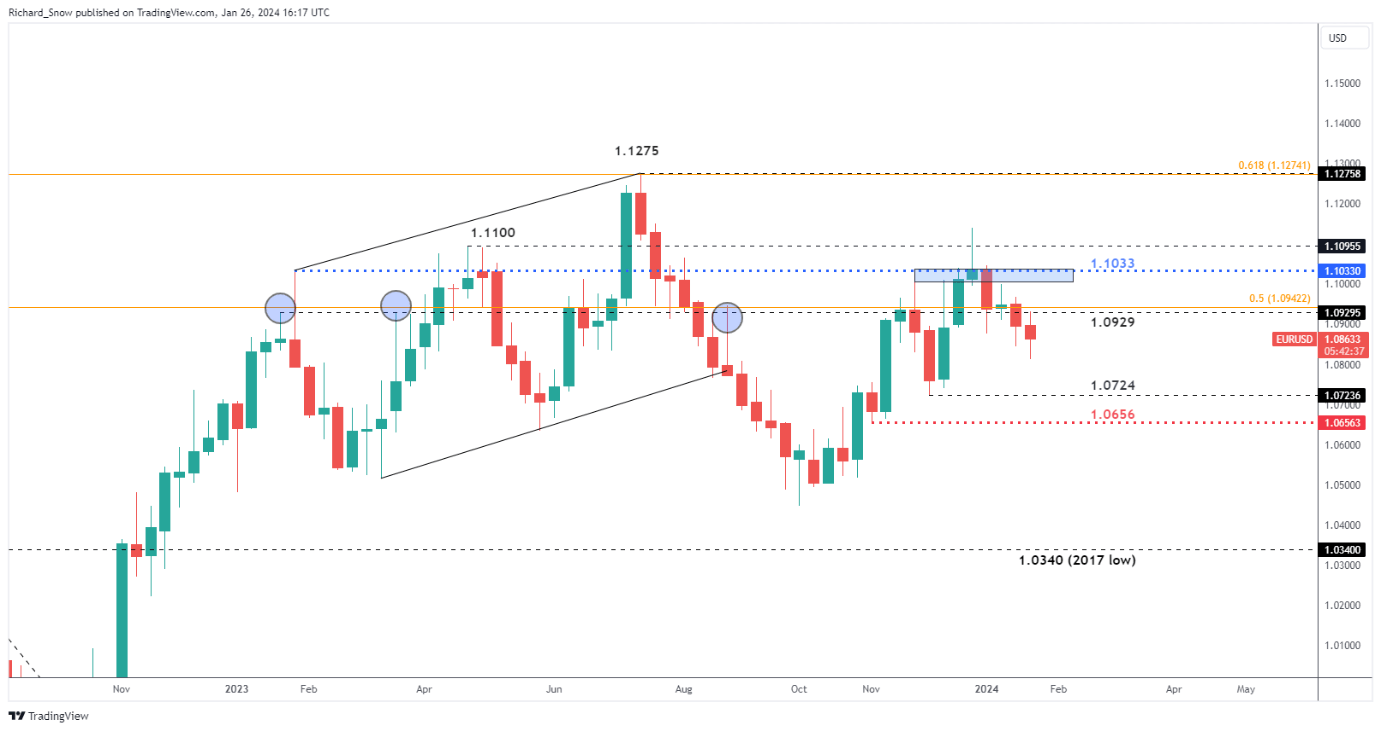
Source: TradingView, prepared by Richard Snow
The daily EUR/USD chart found dynamic resistance at the 50-day simple moving average (SMA), restricting price action between the 50 and 200-day SMAs. The pair was unable to post a directional move in either direction as momentum appeared to be lacking.
In the coming week, I expect the 200 SMA to come under pressure again, especially if EU data disappoints again. Immediate support remains at the 200 SMA, followed closely by 1.0830 with 1,0765 next up (the 38.2% Fibonacci retracement of the 2023 decline).
Resistance remains at the 50-day SMA, followed by the zone of resistance around 1.0950.
EUR/USD Daily Chart
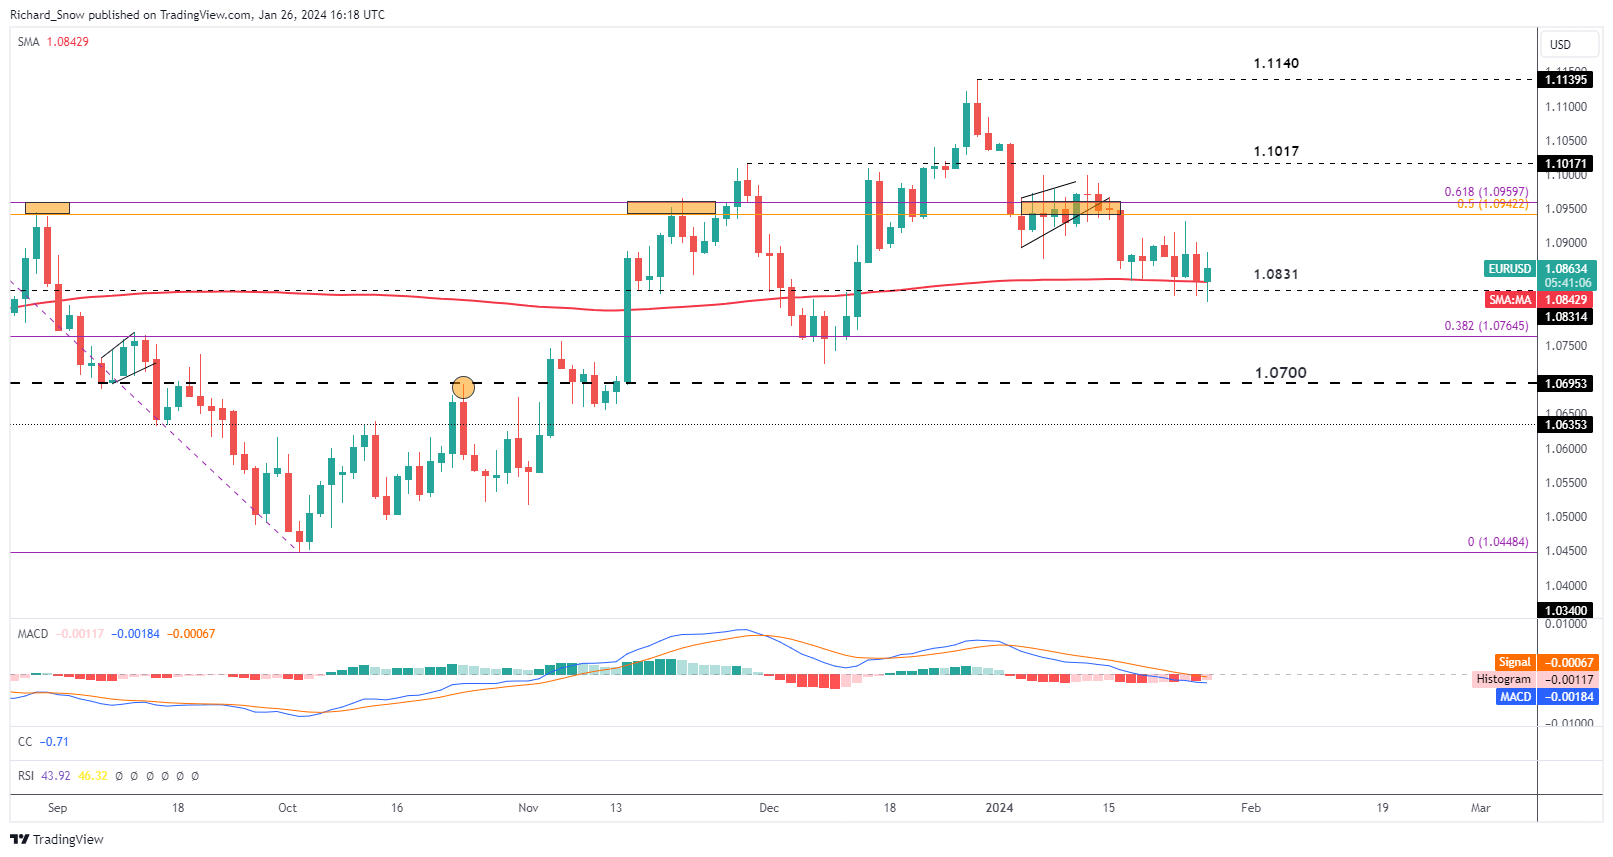
Source: TradingView, prepared by Richard Snow
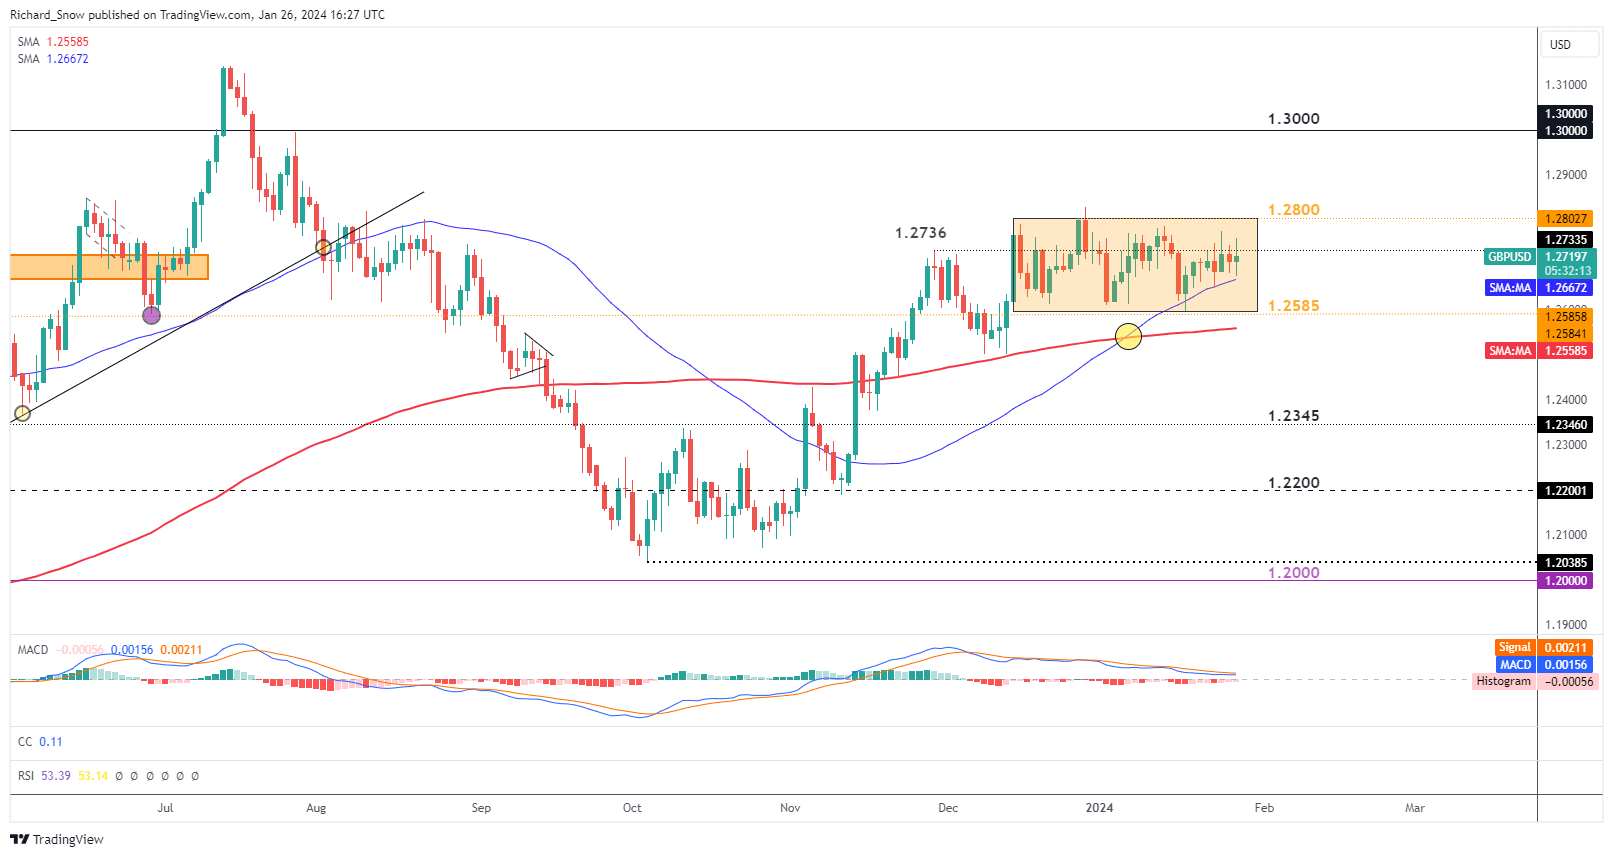
Cable (GBP/USD) Range Likely to be Tested due to Anticipated Lift in Volatility
GBP/USD has traded within a broad range for a number of weeks now with the little sign of sufficient momentum either to the upside or the downside. The 50-day simple moving average has tracked price action closely, acting as dynamic support.
The prior swing high at 1.2736 has repelled bulls, particularly on a daily closing basis evidenced via multiple extended upper wicks. Volatility is anticipated to rise towards the middle of next week around the Bank of England and Fed meetings but that doesn’t promise there’ll be a concerted directional move. In fact, given recent directional uncertainty, the pair may experience an uptick in volatility but revert to trading sideways once the dust settles.
The assumption behind the continued lack of direction is based on the January meetings perhaps not providing much, if any, new information. The January meetings seem like a moment too soon to make drastic changes to policy, allowing central banks the time to more seriously consider changes at later meetings after analysing more data. There will be a lot of new data between the January meeting and the 20th and 21st of March meetings for the Fed and BoE respectively.
GBP/USD Daily Chart
Source: TradingView, prepared by Richard Snow
Recommended by Richard Snow
Get Your Free Top Trading Opportunities Forecast
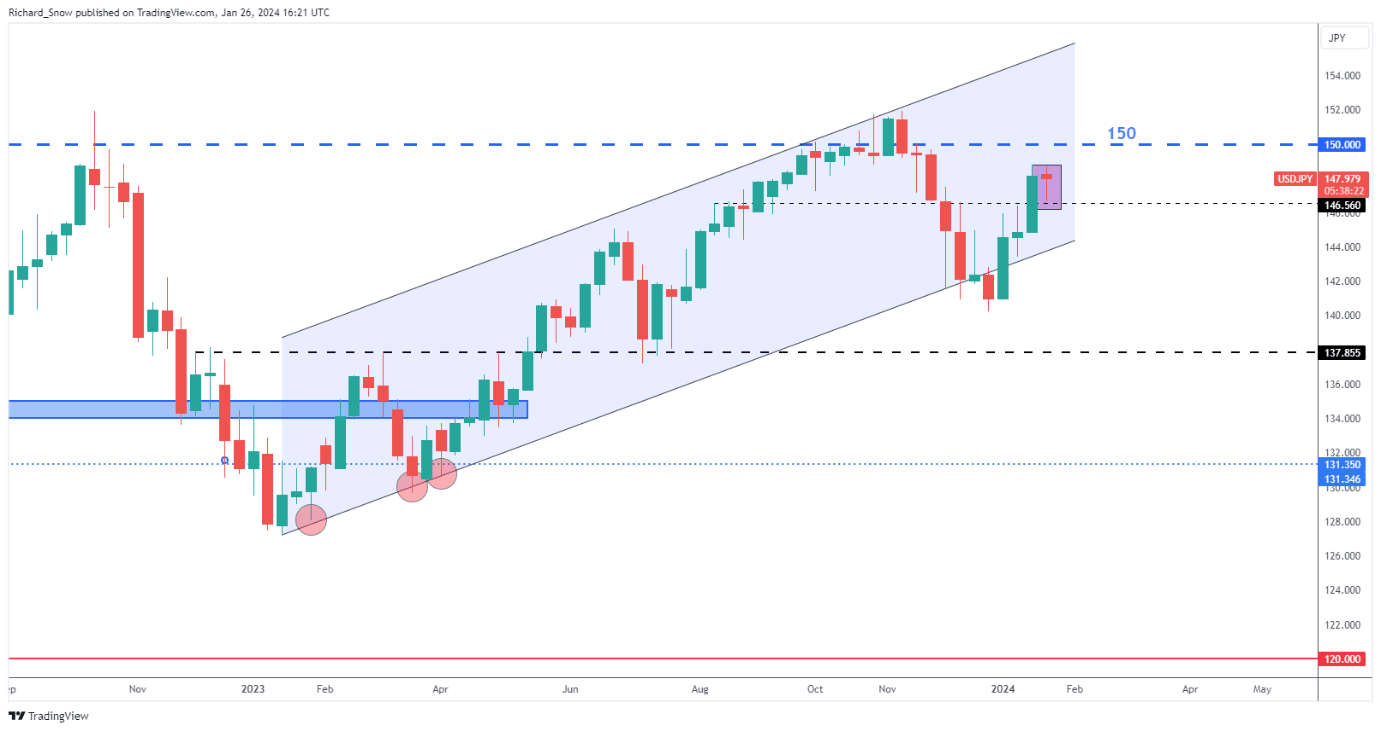
USD/JPY Shows Sign of Fatigue after Strong Bull Run
USD/JPY made a strong and swift recovery after the late December swing low, rising over 6% since then as the markets tapered aggressive rate cut bets which provided broad support for the greenback. The bullish move was helped in part by a more bearish view of the yen which became vulnerable after recent inflation data showed signs of easing.
Japanese CPI has declined over the last two months at a time when the Bank of Japan is closely watching price trends and rising wage growth as the two preconditions for a policy shift. However, after the BoJ meeting, Governor Ueda’s comments continued to focus on what seemed like an inevitable policy shift and crucially admitted that “the probability of reaching the bank’s 2% target is rising gradually” – something that could see the yen reclaiming some lost ground.
The weekly chart reveals a hanging man candle, which is typically viewed as a bearish continuation pattern. Since price was unable to surpass or even retest the prior high, another move lower cannot be disregarded. The major psychological level of 150 appears some distance away but one level to note to the downside is 146.56. A close below this level could see another test of channel support thereafter. While the other pairs reveal a susceptibility to dollar strength, USD/JPY may struggle to rally if broader yen appeal grows.
USD/JPY Weekly Chart
Source: TradingView, prepared by Richard Snow
This forecast provided insight into the three most liquid forex markets, Find out how to trade them by downloading our free multi-guide:
Recommended by Richard Snow
Recommended by Richard Snow
How To Trade The Top Three Most Liquid Forex Pairs
Major US event risk ahead:
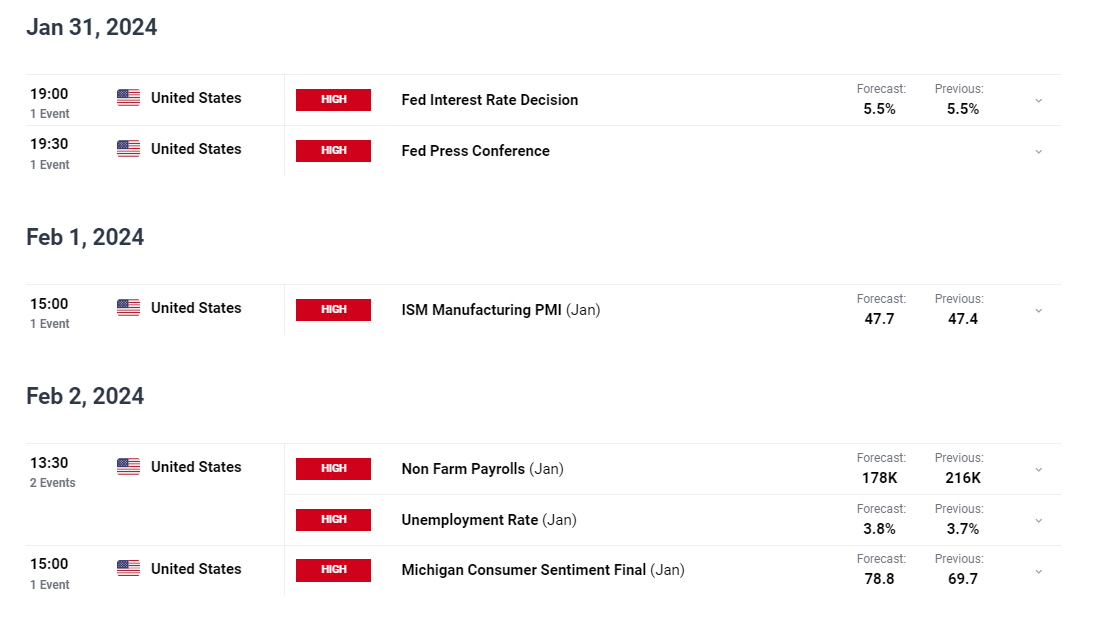
Customize and filter live economic data via our DailyFX economic calendar
— Written by Richard Snow for DailyFX.com
Contact and follow Richard on Twitter: @RichardSnowFX