
US Dollar, Bitcoin, Gold Analysis and Charts
A quiet start to the week across most markets ahead of Tuesday’s US CPI release, although Bitcoin is soaring to a fresh record high.
- US dollar quiet ahead of Tuesday’s US inflation report.
- Bitcoin soars to a new all-time high.
- Gold consolidates recent hefty gains.
Recommended by Nick Cawley
Get Your Free USD Forecast
A quiet start to the week across a range of markets as traders digest last Friday’s NFP number and look at Tuesday’s US inflation Report, the next likely driver of price action. Last week’s US Jobs Report was a mixed bag with a substantial headline beat tempered by a large revision to January’s number and an unexpected tick high in US unemployment.
US Dollar Falls Further After US NFP Beat but January’s Number Revised Sharply Lower
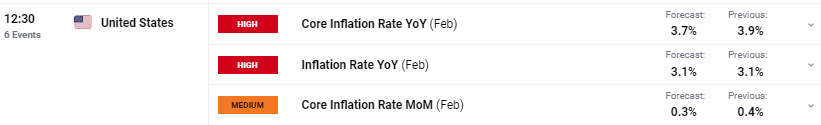
Tuesday’s US inflation data is forecast to show the core reading moving lower while the headline number is seen unchanged. Note, that the US has changed their clocks one hour forward so the data will be released at 12:30 UK.
For all economic data releases and events see the DailyFX Economic Calendar
Learn how to trade economic releases with our complimentary guide
Recommended by Nick Cawley
Trading Forex News: The Strategy
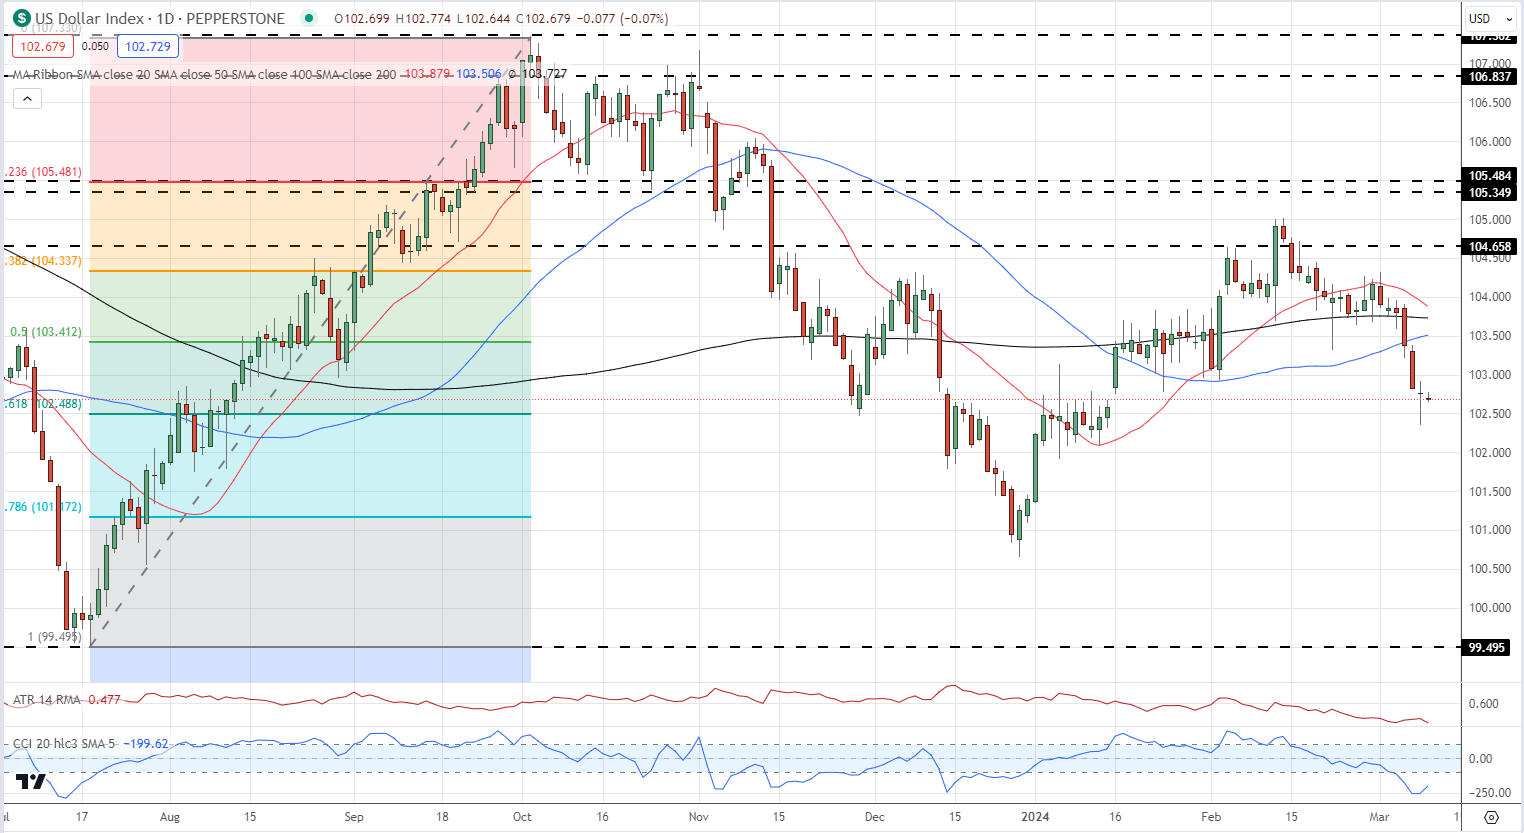
The US dollar index is currently sitting in the middle of Friday’s range. The daily chart shows the dollar index as heavily oversold, using the CCI indicator, but the rest of the chart remains negative with the path of least resistance lower.
US Dollar Index Daily Price Chart
Bitcoin has started the week with a surge, dragging the rest of the cryptocurrency space higher with it. Late last week Bitcoin tried and failed to make a fresh all-time Bitcoin demand remains high, but this morning a new ATH was achieved with ease as buyers took control of the market. Bitcoin demand remains highs, driven primarily by the new ETF providers, while new supply is limited. The supply side of the equation will soon get tighter when the Bitcoin halving event takes place in mid-April.
News also out earlier that the LSE plans to accept applications for Bitcoin and Ethereum ETNs in Q2 may have also helped today’s push higher.
The Next Bitcoin Halving Event – What Does it Mean?
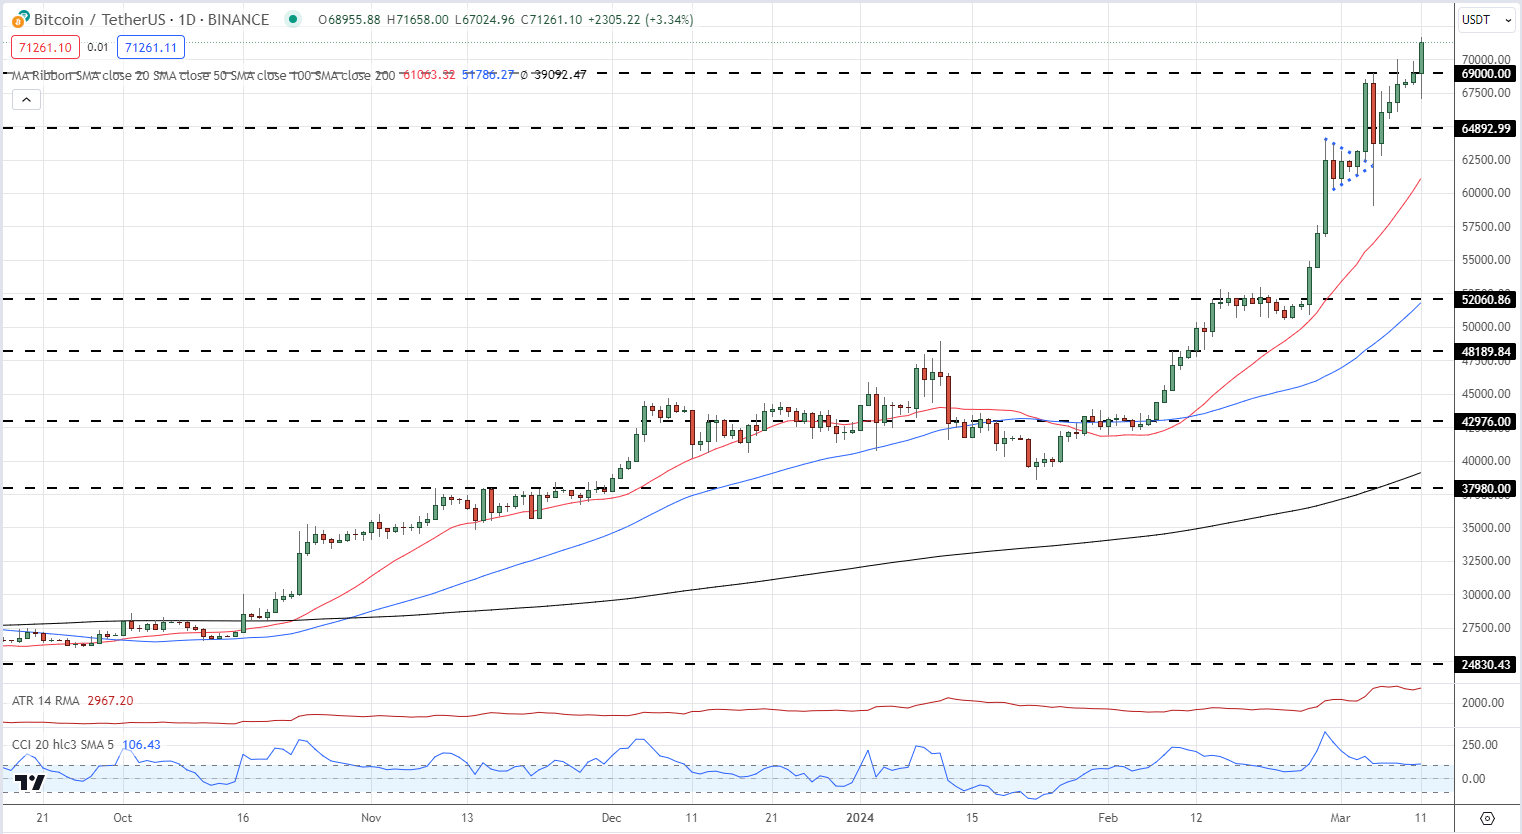
Bitcoin is now in price discovery mode as it trades ever higher. Ongoing demand could see the $75k level tested soon although a sharp reversal lower cannot be discounted. Cryptocurrencies remain highly volatile, highlighted by the March 5th daily candle that showed BTC/USD hitting $69k and $59k in the same session.
Bitcoin Daily Price Chart
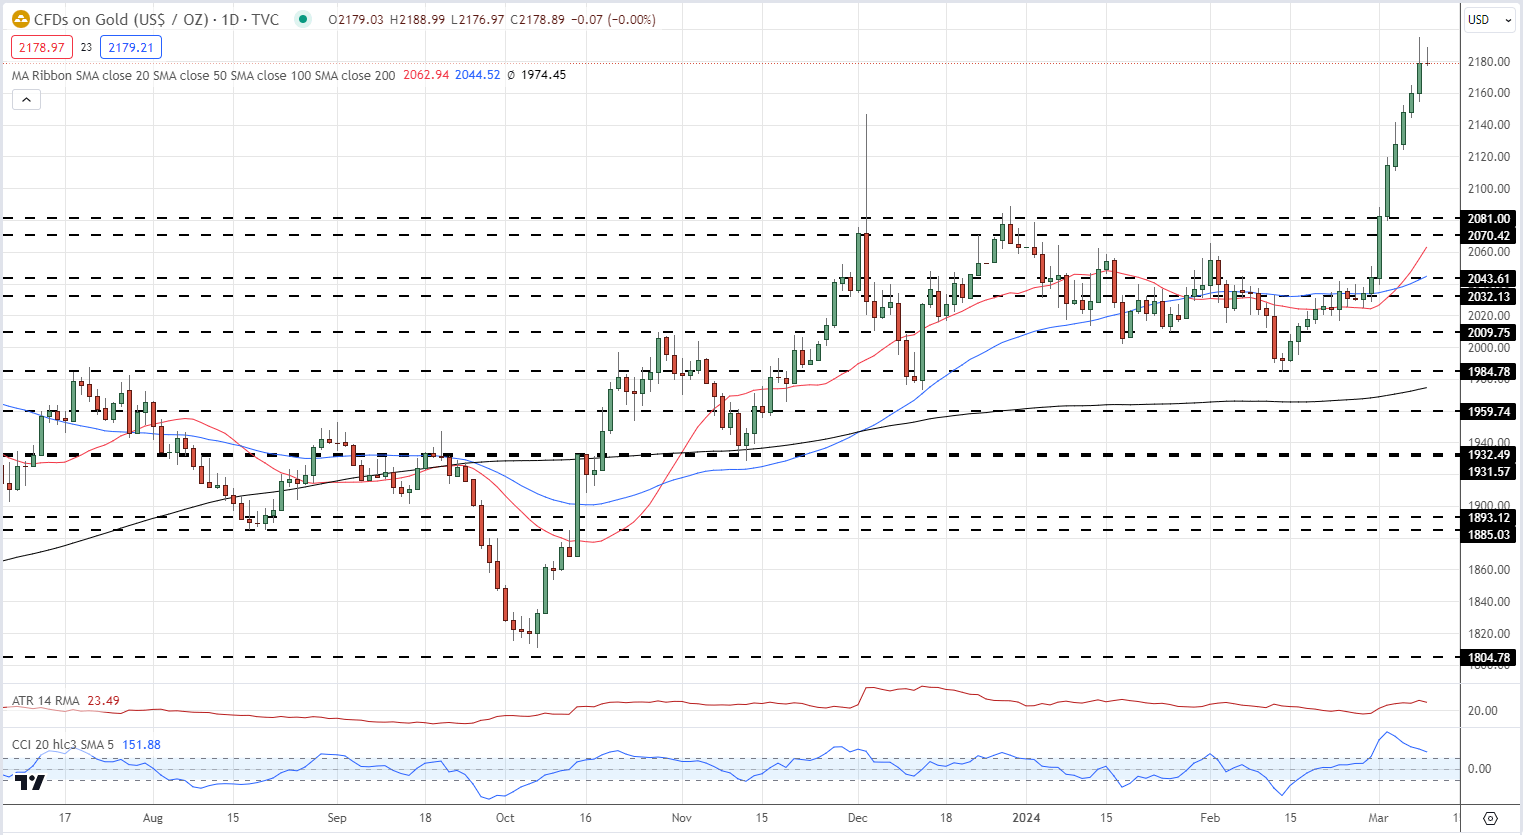
Gold is consolidating around $2,180/oz. in early trade and may well move further higher. The daily chart is positive and the fundamental backdrop remains supportive. Again with gold in all-time territory, accurate price predictions can be difficult. Big figure resistance at $2,200/oz. may come into play shortly.
Gold Daily Price Chart
IG Retail data shows 42.63% of traders are net-long with the ratio of traders short to long at 1.35 to 1. The number of traders net-long is 12.02% higher than yesterday and 4.94% higher than last week, while the number of traders net-short is 4.72% higher than yesterday and 13.87% higher than last week.
We typically take a contrarian view to crowd sentiment, and the fact traders are net-short suggests Gold prices may continue to rise.
| Change in | Longs | Shorts | OI |
| Daily | 15% | 4% | 9% |
| Weekly | 5% | 12% | 9% |
All Charts via TradingView
What are your views on the US Dollar, Gold, and Bitcoin – bullish or bearish?? You can let us know via the form at the end of this piece or you can contact the author via Twitter @nickcawley1.