Most Read: Japanese Yen Forecast: Bearish Signs Build; Setups on USD/JPY, EUR/JPY, GBP/JPY
The US dollar, as measured by the DXY index, climbed on Thursday, supported by rising U.S. Treasury yields. However, gains lacked conviction and volatility was limited as many traders remained on the sidelines awaiting new catalysts in the form of fresh data that could provide additional clues on the Federal Reserve’s monetary policy trajectory.
There are no high-impact macro events scheduled in the U.S. economic calendar for Friday, but next week will see the release of the January inflation report. Forecasts call for a slowdown in annual headline CPI to 3.1% from 3.4% previously. The core gauge is also seen moderating but in a more gradual fashion, easing to 3.8% from 3.9% in December.
If progress on disinflation stalls or proceeds less favorably than anticipated, U.S. Treasury yields are likely to accelerate higher, as traders unwind bets on steep rate cuts currently envisioned for the year and push back the expected start date of the Fed’s easing cycle. This outcome should be fairly bullish for the U.S. dollar, at least in the near term.
For a complete overview of the U.S. dollar’s technical and fundamental outlook, request your complimentary Q1 trading forecast now!
Recommended by Diego Colman
Get Your Free USD Forecast
On the other hand, if inflation figures surprise to the downside, the opposite scenario is likely to unfold, especially if the miss is significant. This outcome should revive dovish interest rate expectations, heightening the likelihood of an initial FOMC cut in March and placing downward pressure on yields. Under these circumstances, we could see a weaker U.S. dollar across the board.
Leaving fundamental analysis aside for now, the remainder of this article will examine the technical outlook for EUR/USD, GBP/USD and gold (XAU/USD). We will also highlight critical price thresholds worth tracking that could serve as support or resistance in the upcoming trading sessions ahead of next Tuesday’s U.S. CPI figures.
If you are discouraged by trading losses, why not take a proactively positive step towards improvement? Download our guide, “Traits of Successful Traders,” and access invaluable insights to assist you in avoiding common trading errors.
Recommended by Diego Colman
Traits of Successful Traders
EUR/USD TECHNICAL ANALYSIS
EUR/USD ticked up on Thursday, approaching resistance at 1.0785. If bulls manage to push prices above this barrier in the coming days, a move toward the 200-day SMA and trendline resistance at 1.0835 may be in the offing. On further strength, the market focus will turn toward the 1.0900 handle.
Conversely, if sellers mount a comeback and drive the pair below support at 1.0720, bearish pressure could intensify, paving the way for a pullback towards 1.0650. The pair may stabilize around these levels during a retracement, but a breakdown could precipitate a decline towards 1.0524.
EUR/USD TECHNICAL ANALYSIS CHART
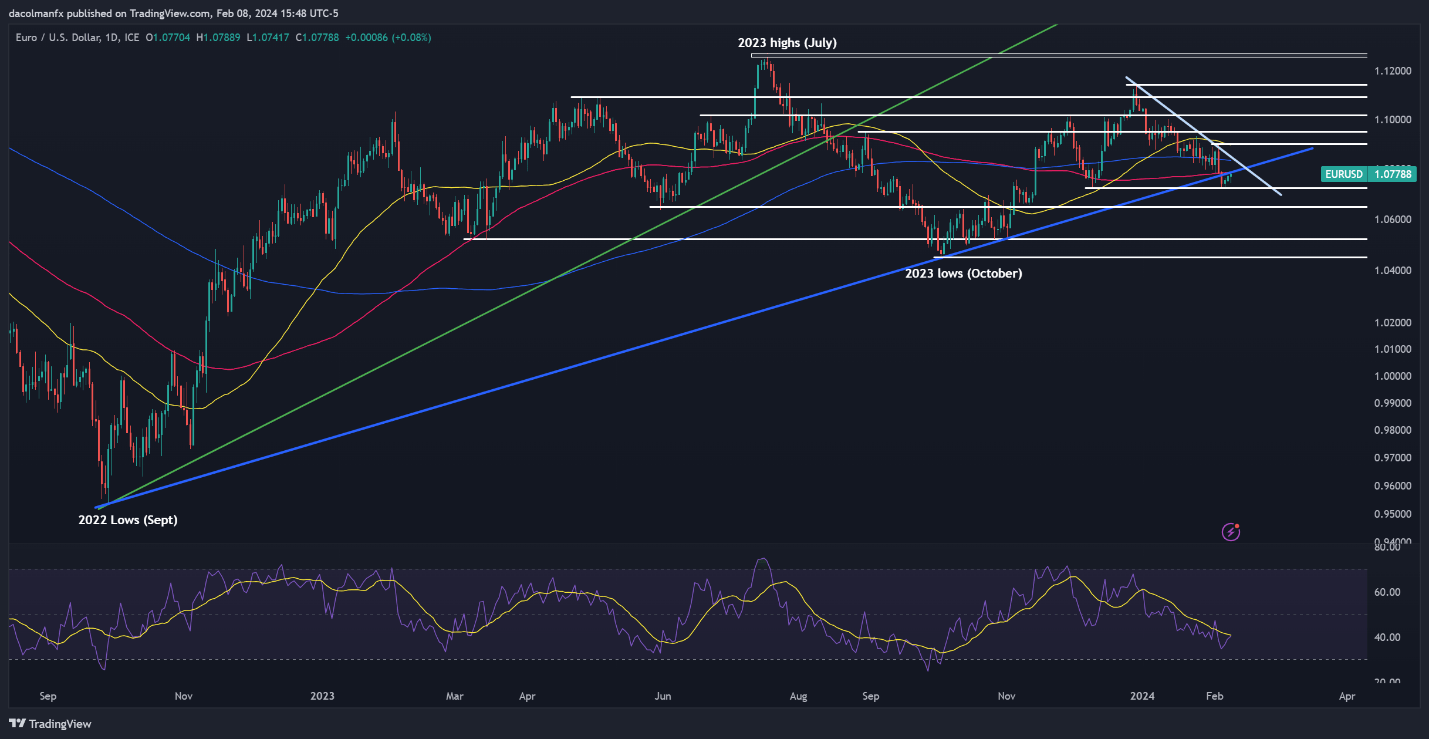
EUR/USD Chart Created Using TradingView
For an extensive analysis of the British pound’s medium-term prospects, download our Q1 trading forecast now!
Recommended by Diego Colman
Get Your Free GBP Forecast
GBP/USD TECHNICAL ANALYSIS
After last Friday and Monday’s decline, GBP/USD has mounted a moderate comeback, recapturing its 200-day simple moving average and pushing past the 1.2600 level. If cable’s recovery extends, a key technical ceiling appears at 1.2675. Looking upwards, trendline resistance at 1.2750 comes into view.
On the other hand, if GBP/USD pivots downwards and breaches the 1.2600 mark, the 200-day SMA at 1.2565 is likely to be an important support level. Bulls need to staunchly defend this floor; failure to do so could result in a slump towards 1.2455.
GBP/USD TECHNICAL CHART
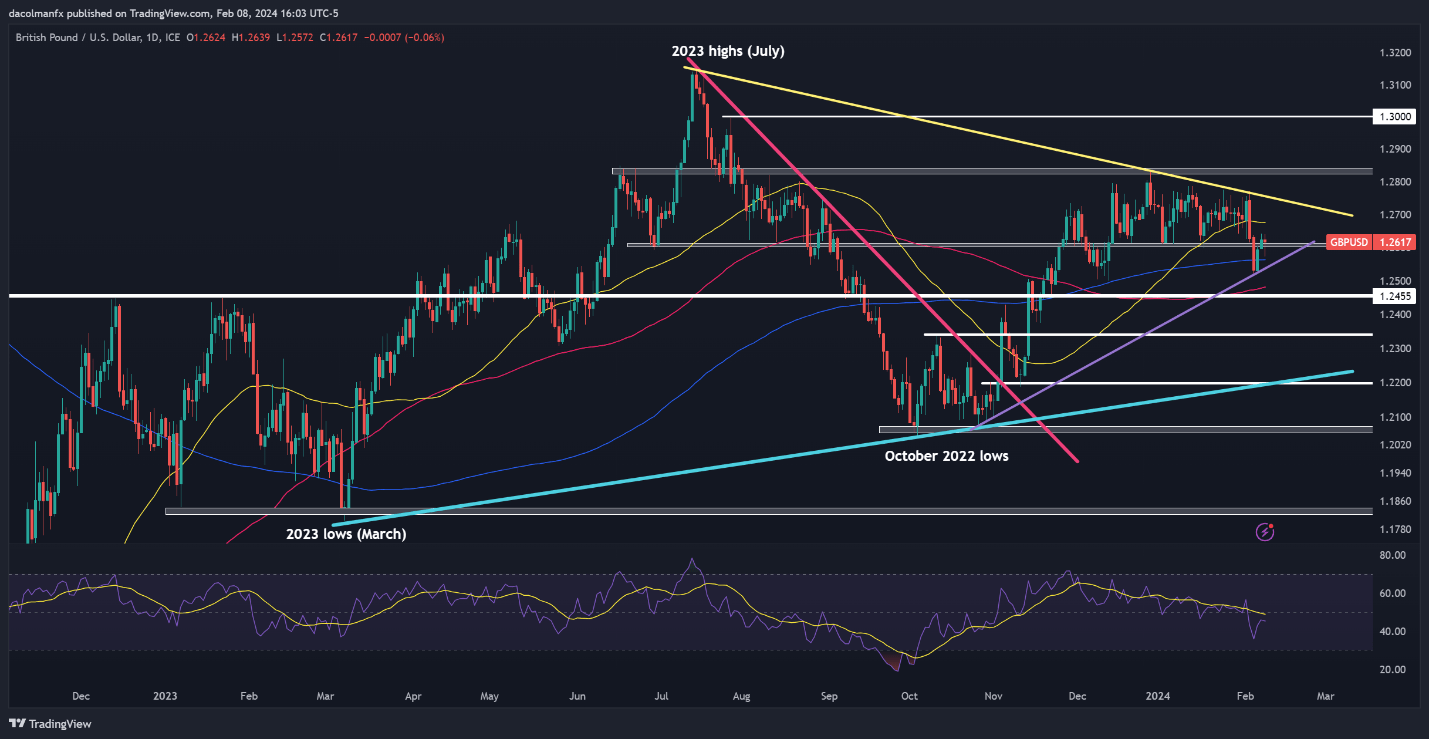
GBP/USD Chart Created Using TradingView
Wondering how retail positioning can shape gold prices in the near term? Our sentiment guide provides the answers you are looking for—don’t miss out, get the guide now!
Recommended by Diego Colman
Get Your Free Gold Forecast
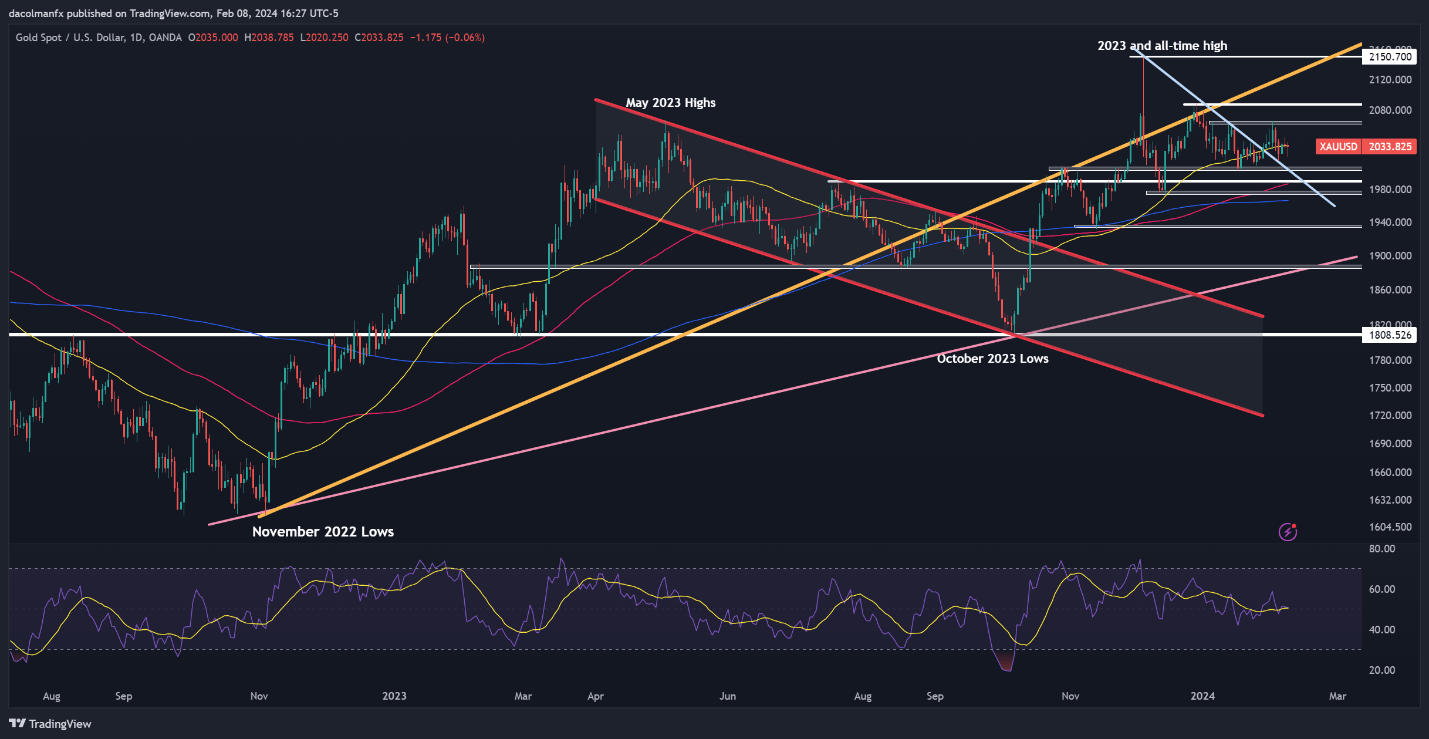
GOLD PRICE TECHNICAL ANALYSIS
Gold (XAU/USD) was muted on Thursday, consolidating around the 50-day simple moving average near $2,035. This consolidation period is likely to continue until prices either breach technical resistance at $2,065 or horizontal support at $2,005.
In terms of possible scenarios, a resistance breakout could usher in a rally towards $2,085. On continued strength, attention may hone in on the all-time high near $2.150. Conversely, a support breakdown could amplify bearish pressure, exposing first $1,990 and then $1,975.
GOLD PRICE (XAU/USD) TECHNICAL CHART