
Kiwi Dollar Price Action Setups
- NZD/USD tests long-term trend filter amid dovish repricing
- GBP/NZD bulls eye extension towards crucial resistance zone
- NZD/JPY pullback accelerates after hawkish BoJ comments
NZD/USD Tests Long-Term Trend Filter Amid Dovish Repricing
NZD/USD has sold off in recent trading sessions but appears to be attempting to latch onto support. The 200-day simple moving average (SMA) appears as the next significant challenge for bears with yesterday’s and today’s (thus far) candles exhibiting a slight lower wick ahead of the trend filter.
0.6050 is the next level of support should bulls fail to overcome selling pressure and this represents a key level that acted as resistance in October last year, proving to be a pivot point on multiple occasions thereafter. Therefore, 0.6050 can be seen as a tripwire for further downside potential.
NZD/USD Daily Chart
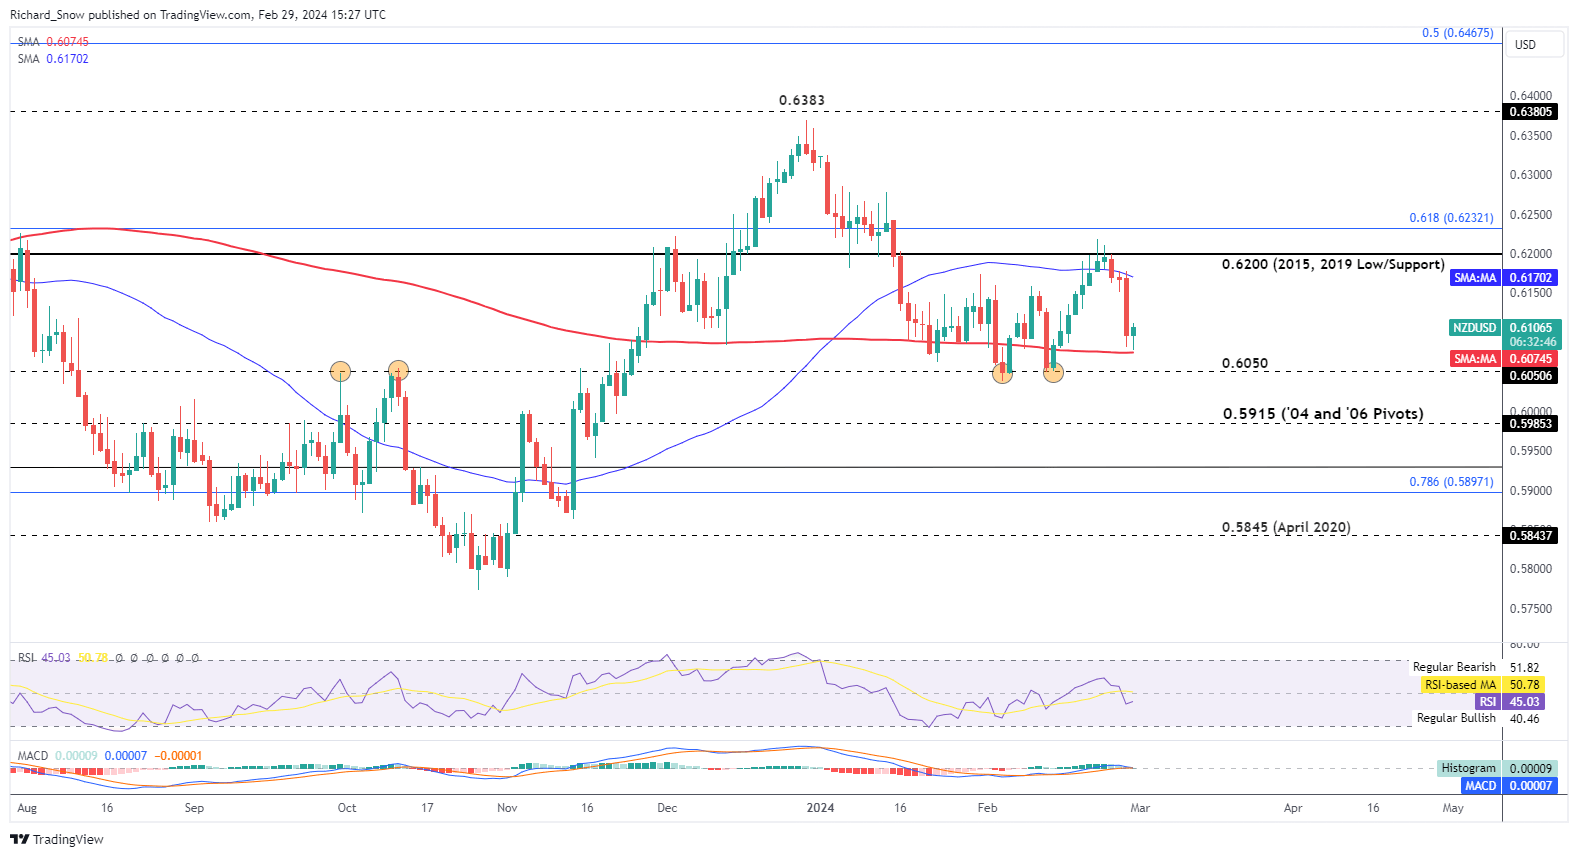
Source: TradingView, prepared by Richard Snow
There are three main market conditions: Trending, ranging and breakout. Learn how to master them all:
Recommended by Richard Snow
Recommended by Richard Snow
Master The Three Market Conditions
GBP/NZD Bulls Eye Extension Towards Crucial Resistance Zone
GBP/NZD has retreated from the 2023 high and has attempted to get back up there but has ultimately fallen short at the zone of resistance, around 2.1000. The pair still has some way to go to make another legitimate test of this level and the quiet week for sterling could support this.
Prices have bounced off of the 61.8% Fibonacci retracement of the major 2020 to 2022 decline (2.0413).
GBP/NZD Weekly Chart
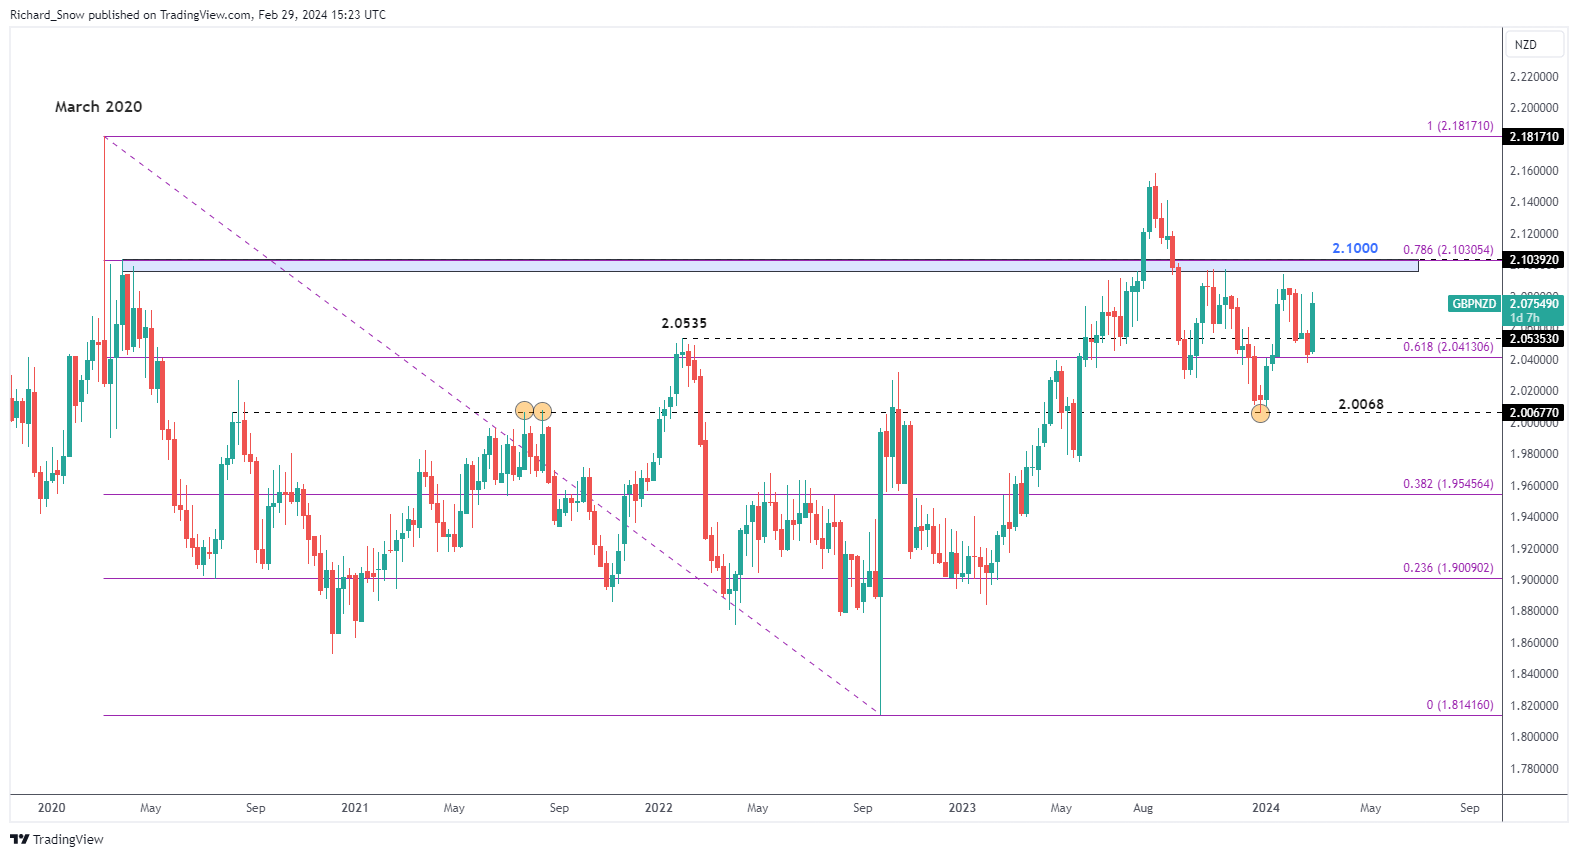
Source: TradingView, prepared by Richard Snow
The daily chart shows this dynamic in more granular detail with prices now above both the 200 and 50 SMA – although, these have not aligned to suggest a bull trend (50 SMA < 200 SMA).
Momentum appears to be favouring the upside but is lacking the necessary conviction for a stronger bullish bias. The pound has fared well this week and has benefitted from a lack of economic data. The catalyst for this pair may appear at next week’s UK Spring Statement and if there are any measures or omissions that have an impact on the bond market.
GBP/NZD Daily Chart
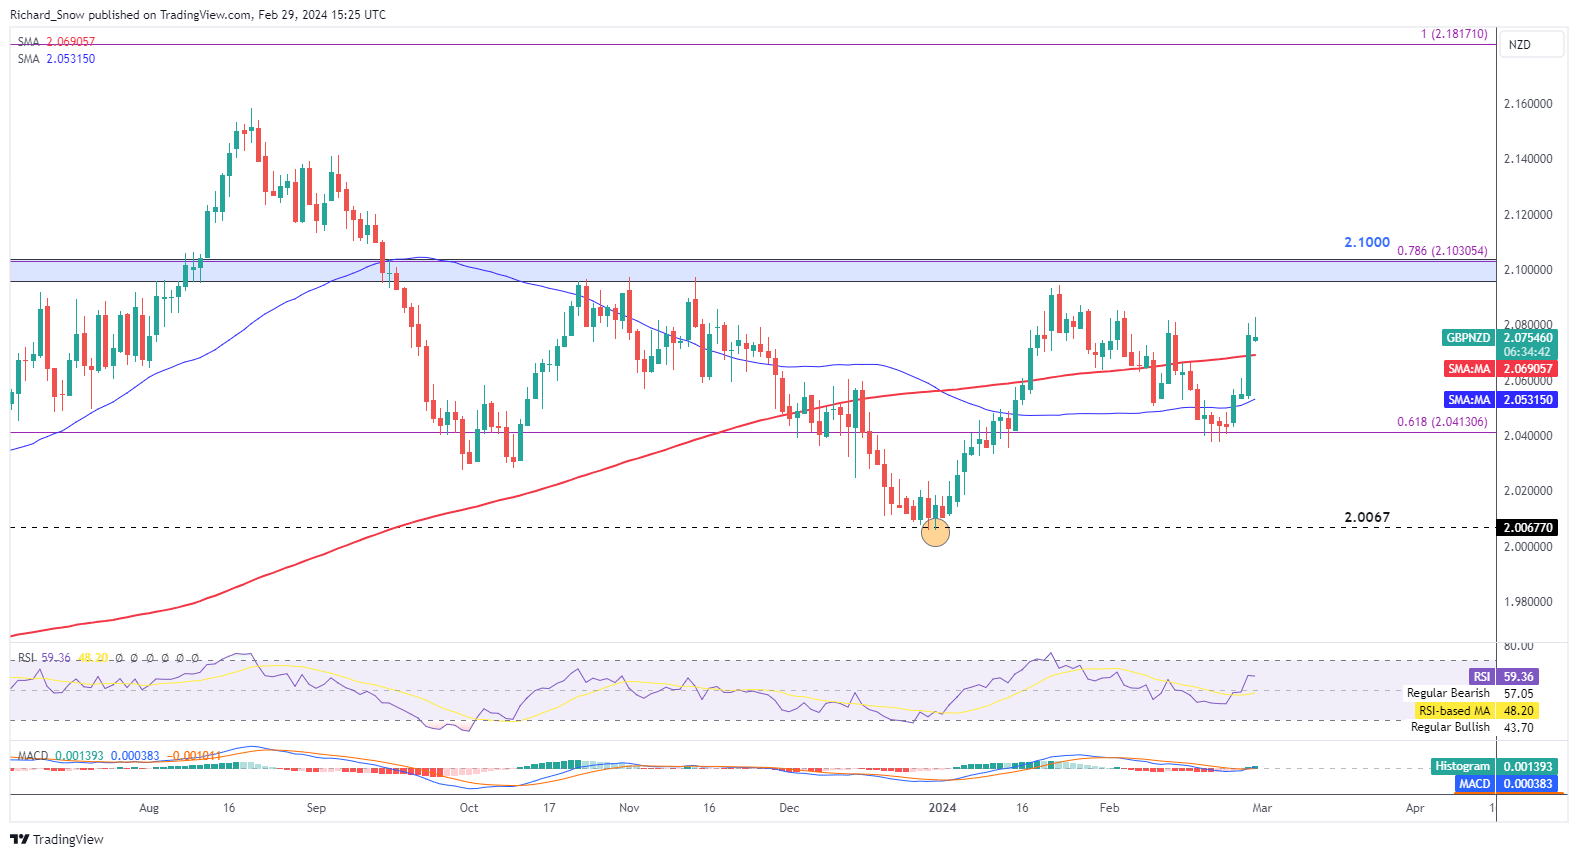
Source: TradingView, prepared by Richard Snow
NZD/JPY Pullback Accelerates After Hawkish BoJ Comments
Bank of Japan board member Hajime Takata added to the narrative that Japan will come out of negative interest rates and that the process must transpire in the least disruptive manner. She also affirmed that the Bank’s 2% target is within sight, sending the yen higher against G7 currencies.
The chart below reveals the recent swing high with prices now heading towards the first dynamic support level – the 50 SMA. The longer-term trend is bullish but it has not risen in a uniform manner, instead prices have risen in more of a choppy fashion – providing opportunity for re-entry into the bull market at numerous stages.
The pullback is further supported by the RSI breaching, and now retreating from, overbought conditions as momentum turns lower – evidenced by the blue MACD line crossing the red signal line. The bearish move remains constructive as long as prices remain below the prior swing high around 91.50 but the 50 SMA may not provide immediate support as it has been unreliable in the past.
A major risk to continued downside is the tendency for yen sellers to quickly disregard hawkish statements from the BoJ, at least until we get crucial wage data in the middle of next month.
NZD/JPY Daily Chart
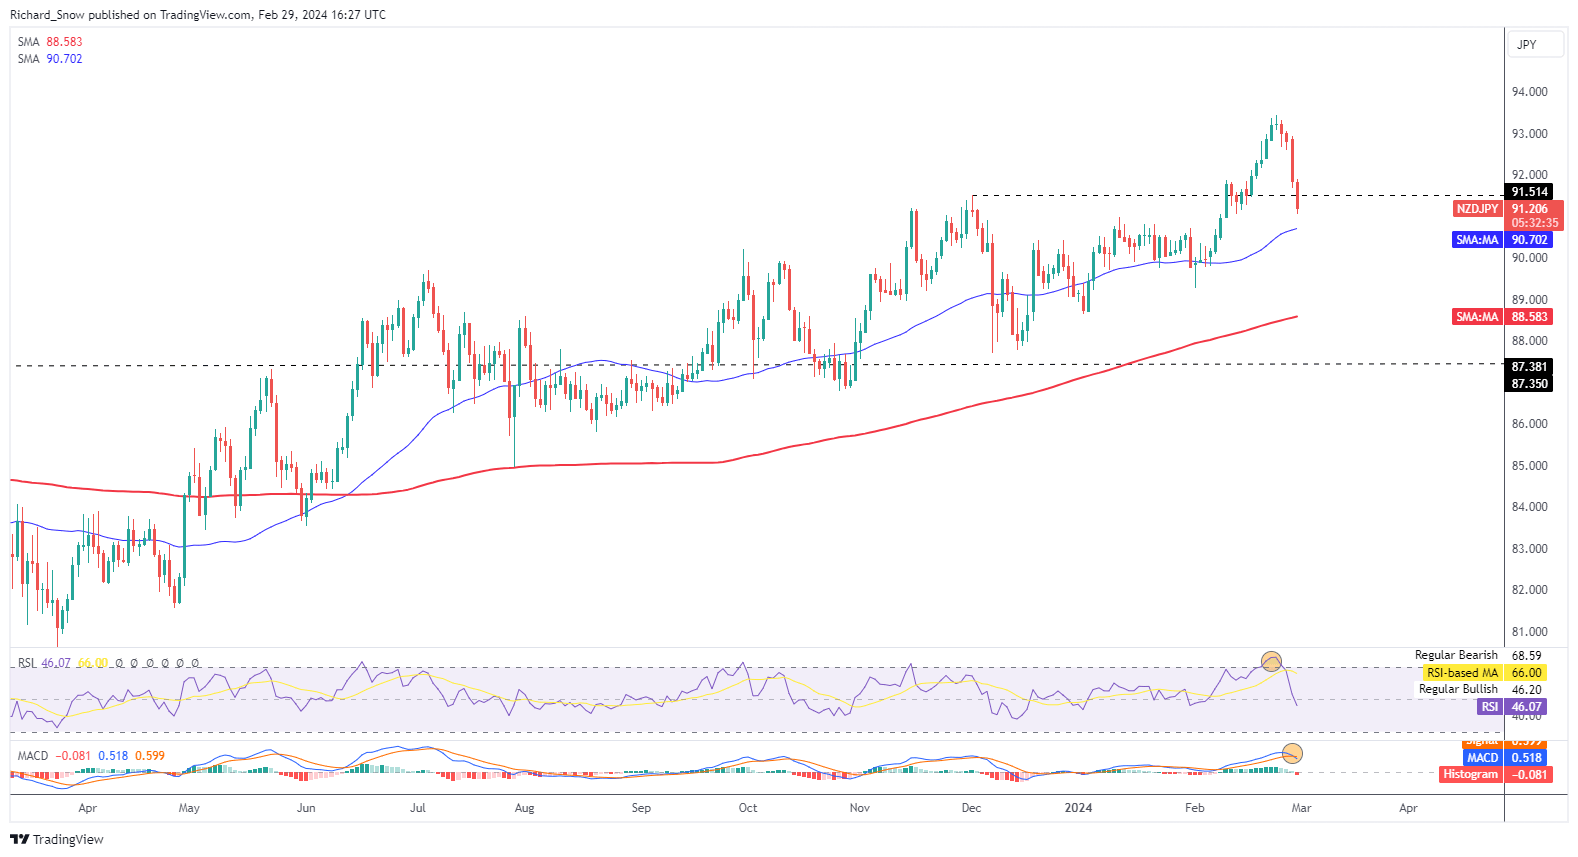
Source: TradingView, prepared by Richard Snow
Trade Smarter – Sign up for the DailyFX Newsletter
Receive timely and compelling market commentary from the DailyFX team
Subscribe to Newsletter
— Written by Richard Snow for DailyFX.com
Contact and follow Richard on Twitter: @RichardSnowFX