Gold (XAU/USD) Weekly Forecast: Bearish
- Gold volatility spike heads lower, alongside the precious metal itself
- Potential evening star emerges moments after printing the new all-time high
- The analysis in this article makes use of chart patterns and key support and resistance levels. For more information visit our comprehensive education library
Recommended by Richard Snow
How to Trade Gold
Gold Volatility Spike Heads Lower, Alongside the Precious Metal Itself
GVZ, or the gold volatility index, witnessed a strong move higher on Thursday as markets digested the recent Fed statement and latest summary of economic projections. The projections invalidated a growing belief in the market that the Fed will be forced to forgo a third rate cut in 2024 due to robust US data and resulted in a dovish repricing in the dollar.
However, it has not taken long for markets to rally behind the dollar once again – something that is likely to keep the greenback supported into Friday’s PCE data which falls on Good Friday.
The chart below reveals gold’s recent responsiveness to the dollar (DXY) and shorter-term yields like the US 2-year yield. The aggressive move higher corresponded with falling yields and a lower USD but shortly thereafter,
Daily Gold Chart with DXY and 2-Year US Treasury Yields
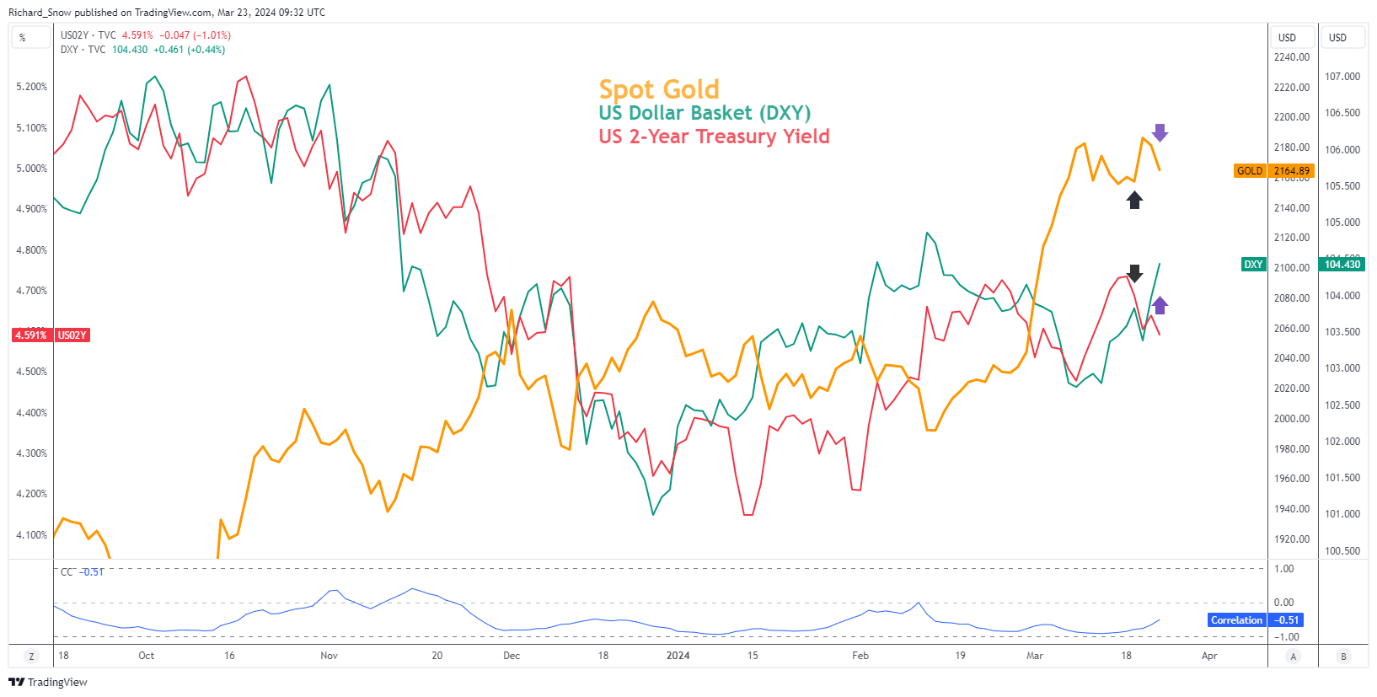
Source: TradingView, prepared by Richard Snow
Potential Evening Star Emerges Moments After Printing the New All-Time High
An evening star could be emerging as the week came to a close, although the middle candle has a very notable upper wick which is not synonymous with the candle stick pattern. Nevertheless, price action suggests the recent move higher was an overreaction to the Fed news, as prices continued to ease into the weekend.
At the start of the coming week, the prior high of $2146.80 comes immediately into view as an early indication of whether bears may set the tone for the week. It’s a quiet week apart from final Q4 GDP data for the US and UK just to list a few and then on Friday PCE data for the month of Feb is due.
The dollars strong, immediate recovery poses a challenge for further upside for gold over the shorter-term and with few catalysts to choses from next week, gold may consolidate around the prior all time high with a view to trade lower.
Daily Gold Chart (XAU/USD)
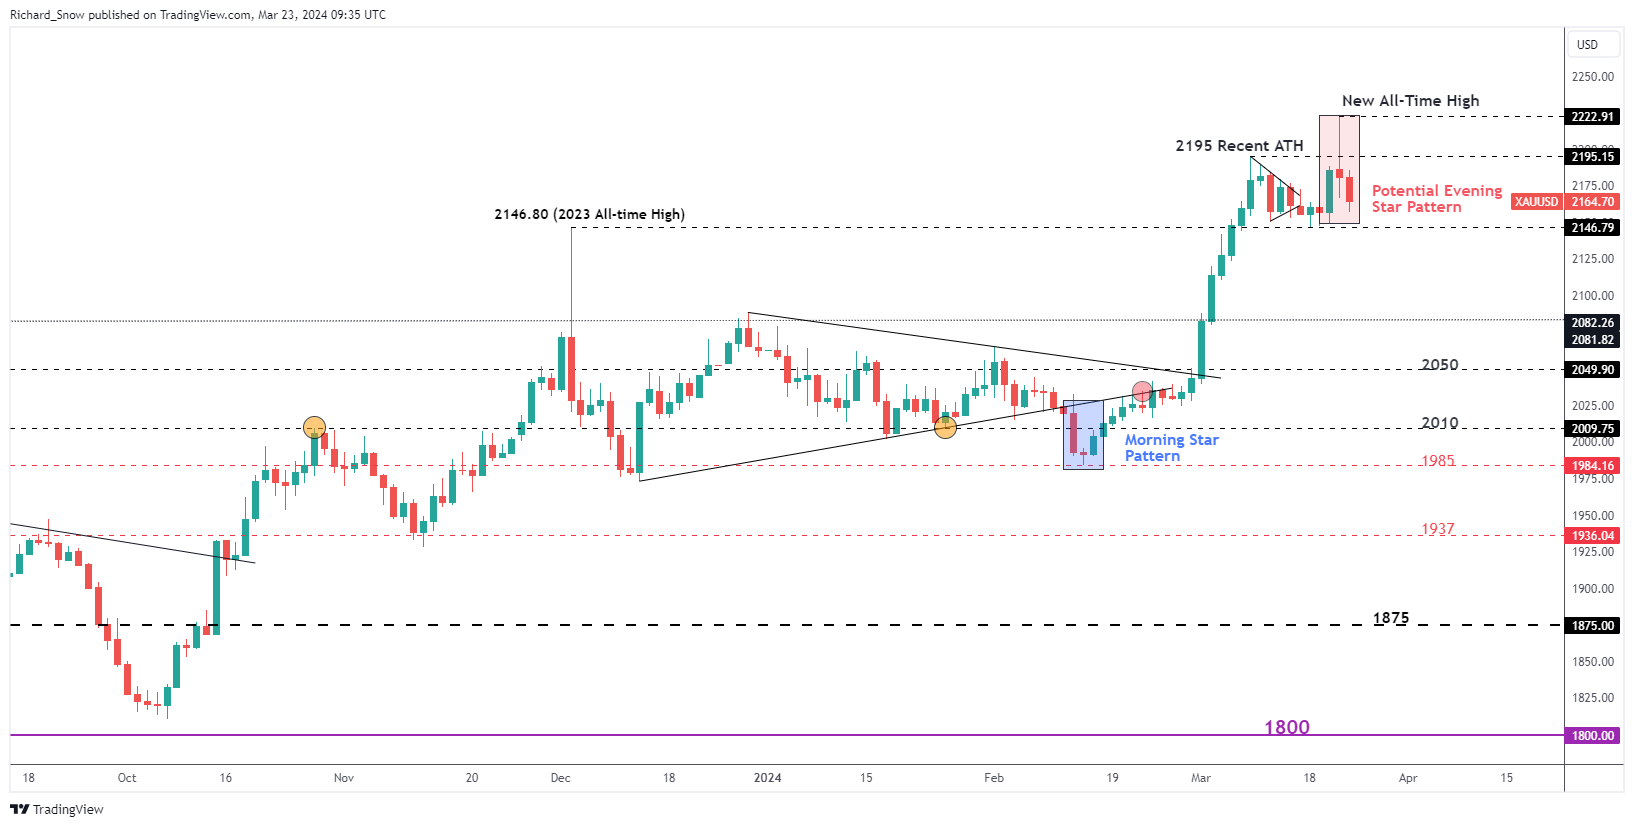
Source: TradingView, prepared by Richard Snow
The weekly chart helps put golds multi-week advance into perspective. The week before the one that’s just passed revealed a bit of a slowdown in bullish momentum and the candle relating to the most recent trading week that’s just come to a close, reveals a rejection of higher prices.
Weekly Gold Chart
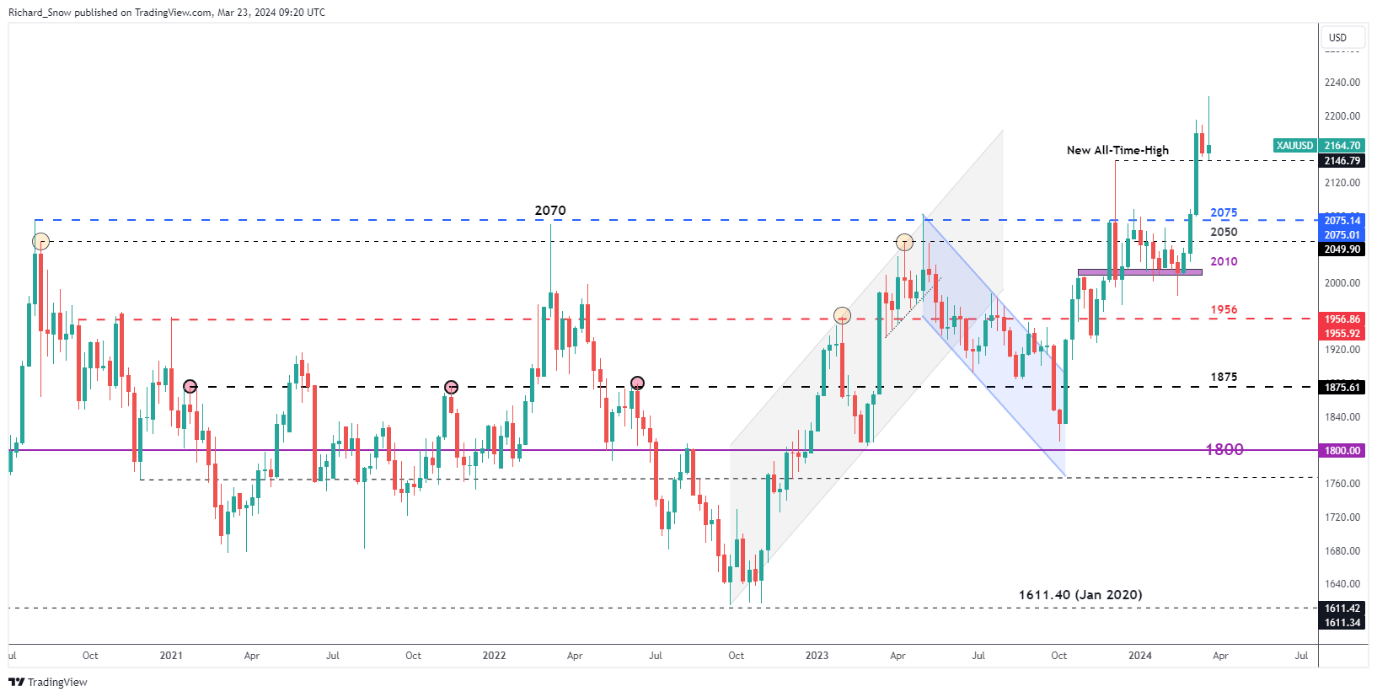
Source: TradingView, prepared by Richard Snow
Stay up to date with the latest breaking news and themes driving the market by singing up to the DailyFX weekly newsletter:
Trade Smarter – Sign up for the DailyFX Newsletter
Receive timely and compelling market commentary from the DailyFX team
Subscribe to Newsletter
— Written by Richard Snow for DailyFX.com
Contact and follow Richard on Twitter: @RichardSnowFX