
Gold Price and Analysis
- Gold prices have topped $2050 for the first time since February 2
- Both headline and Core PCE inflation readings came in lower, as forecast
- Hopes for lower rates in the year’s second half remain intact
Learn how to trade gold with our complimentary guide
Recommended by David Cottle
How to Trade Gold
Gold Prices rose on Thursday following the release of a mixed bag of important economic numbers out of the United States.
Perhaps the most important of these was the inflation snapshot in the Personal Consumption Expenditures series. This is known to be among the Federal Reserve’s favored pricing measures, so its presumed impact on monetary policy tends to make it a regular showstopper for markets.
This time the numbers came in exactly as expected, with the headline price index up 2.4% in January, from December’s 2.6%, and the ‘core’ reading up by 2.8%, from 2.9%. This deceleration will keep rate cut hopes alive, even if they’re not likely to come especially soon.
Still, the overall price index ticked up again on the month, rising by 0.3%, with the core gaining a more worrying 0.4%.
Jobless claims figures were released at the same time and showed both new and continuing claims rising slightly ahead of forecasts.
All up, these numbers probably won’t shift the dial on interest-rate expectations, with the first reduction now thought likely to be in June. However, they do underline that the inflation threat remains visible and that near-term rate reductions of any kind can’t be seen as certain yet. Some expected early rate cuts at the start of this year. Now the second half of 2024 seems like the earliest possible date.
Yielding nothing, gold might be expected to do better when investors see lower rates and lower yields ahead, and it seems to have benefitted a bit from this impulse on Thursday.
Gold prices added about $10/ounce after the data.
Gold Prices Technical Analysis
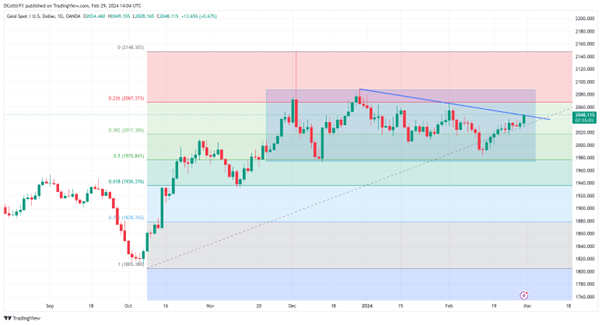
Gold Price Daily Chart Compiled Using TradingView
Like many other asset classes and foreign-exchange pairs gold is range-trading beneath its recent significant highs.
While the psychological $2000 point remains some way below the market, there is an incipient downtrend in place now from the peaks of December 29 which was tested right after the release of the data. It currently offers resistance at $2046.76, which appears to be holding.
Near-term support is likely at 2017.31, which is the second Fibonacci retracement of the rise to December 4’s peaks from the lows of last October. The market last bounced there on February 23 and hasn’t retested that level since.
IG’s sentiment indicator finds traders pretty evenly split about where gold goes from here. They have a modestly bullish bias, with 55% long at current prices. This doesn’t look like enough to break gold’s broader range, established since late November, but a durable break of that downtrend might make things a little more interesting.
| Change in | Longs | Shorts | OI |
| Daily | -5% | -3% | -4% |
| Weekly | -13% | 12% | -4% |
–By David Cottle for DailyFX