
Gold (XAU/USD) Price Analysis and Chart
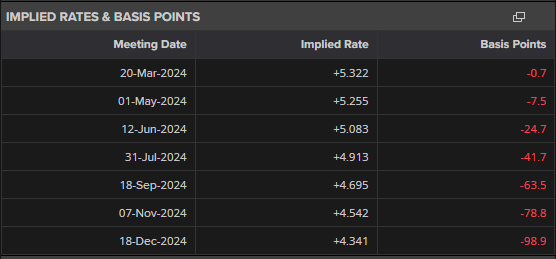
- US rates markets fully price in a 25 basis point in June.
- The path of least resistance for gold remains higher for now.
Recommended by Nick Cawley
How to Trade Gold
Most Read: US Dollar Falls Further After US NFP Beat But January Number Revised Sharply Lower
The latest round of Fed commentary has pushed financial markets to fully price in the first 25bp interest rate cut at the June 12th FOMC meeting. Three quarter-point rate cuts are also fully priced-in for 2024 with a probability of a fourth cut nearly fully priced. It seems the time for talking is now over and the time for the US central bank to start acting is now here.
The economic calendar has a handful of important US releases next week with Tuesday’s US inflation report the most notable. The latest Fed commentary suggests that the US central bank is pleased with the current disinflationary trend and it will take a big beat of either of the y/y inflation numbers to change, or delay, the Fed’s timetable for interest rate cuts.
Recommended by Nick Cawley
Traits of Successful Traders
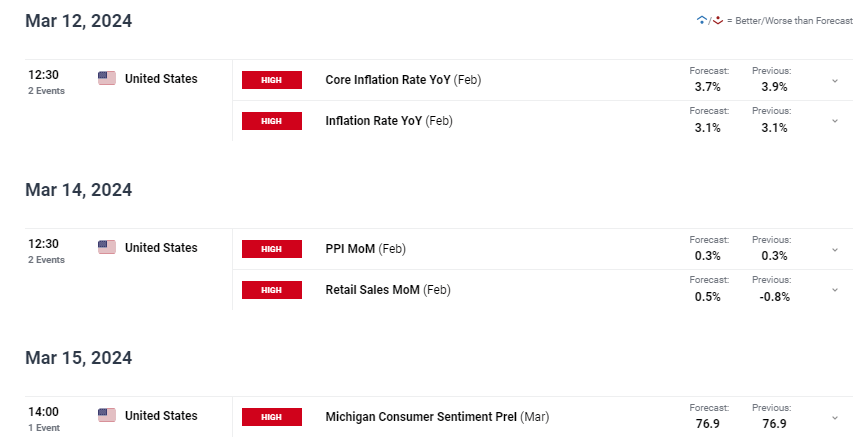
For all market-moving economic data and events, see the DailyFX Economic Calendar.
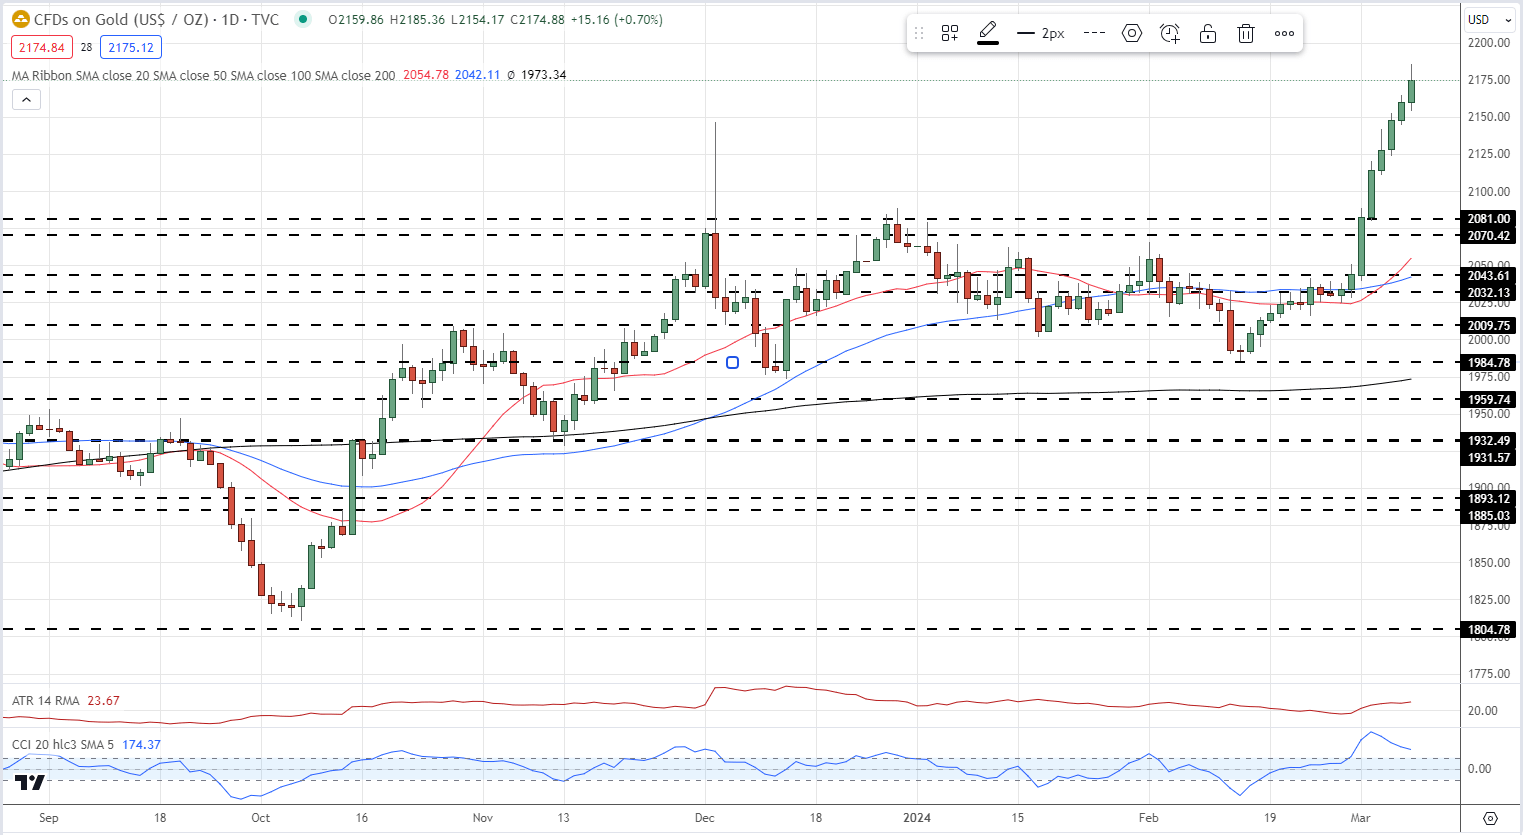
The daily gold price chart continues to move higher into fresh territory. While the CCI indicator shows gold as being overbought, the daily candle setup remains positive. Over the last six sessions, gold has opened at the day before’s closing price before steadily pushing higher, leaving it difficult for bullish traders who are looking for a short-term sell-off to enter the market. There may be a short-term period of consolidation, with $2,100/oz. and then $2,081/oz. looking solid support levels, but the path of least resistance for gold over the coming weeks looks higher.
Gold Daily Price Chart
Retail trader data show 42.92% of traders are net-long with the ratio of traders short to long at 1.33 to 1.The number of traders net-long is 2.18% lower than yesterday and 6.78% lower from last week, while the number of traders net-short is 0.19% lower than yesterday and 45.36% higher from last week.
We typically take a contrarian view to crowd sentiment, and the fact traders are net-short suggests Gold prices may continue to rise.
See what these swings in positioning mean for the price of gold
| Change in | Longs | Shorts | OI |
| Daily | -10% | -4% | -7% |
| Weekly | -4% | 23% | 10% |
What is your view on Gold – bullish or bearish?? You can let us know via the form at the end of this piece or you can contact the author via Twitter @nickcawley1.