Gold (XAU/USD) and Silver (XAG/USD) Price, Analysis and Chart
- Gold trading on either side of $2,165/oz. but a break may be near.
- Silver prints a fresh three-month high.
Most Read: Euro Slides Against Perky Dollar as US Inflation Springs Upside Surprise.
The latest US PPI data – wholesale inflation – came in above market expectations, and last month’s print, but the dollar and US rate cut forecasts, remain little changed. US Retail Sales in February picked up, turning positive, but again missed market forecasts.

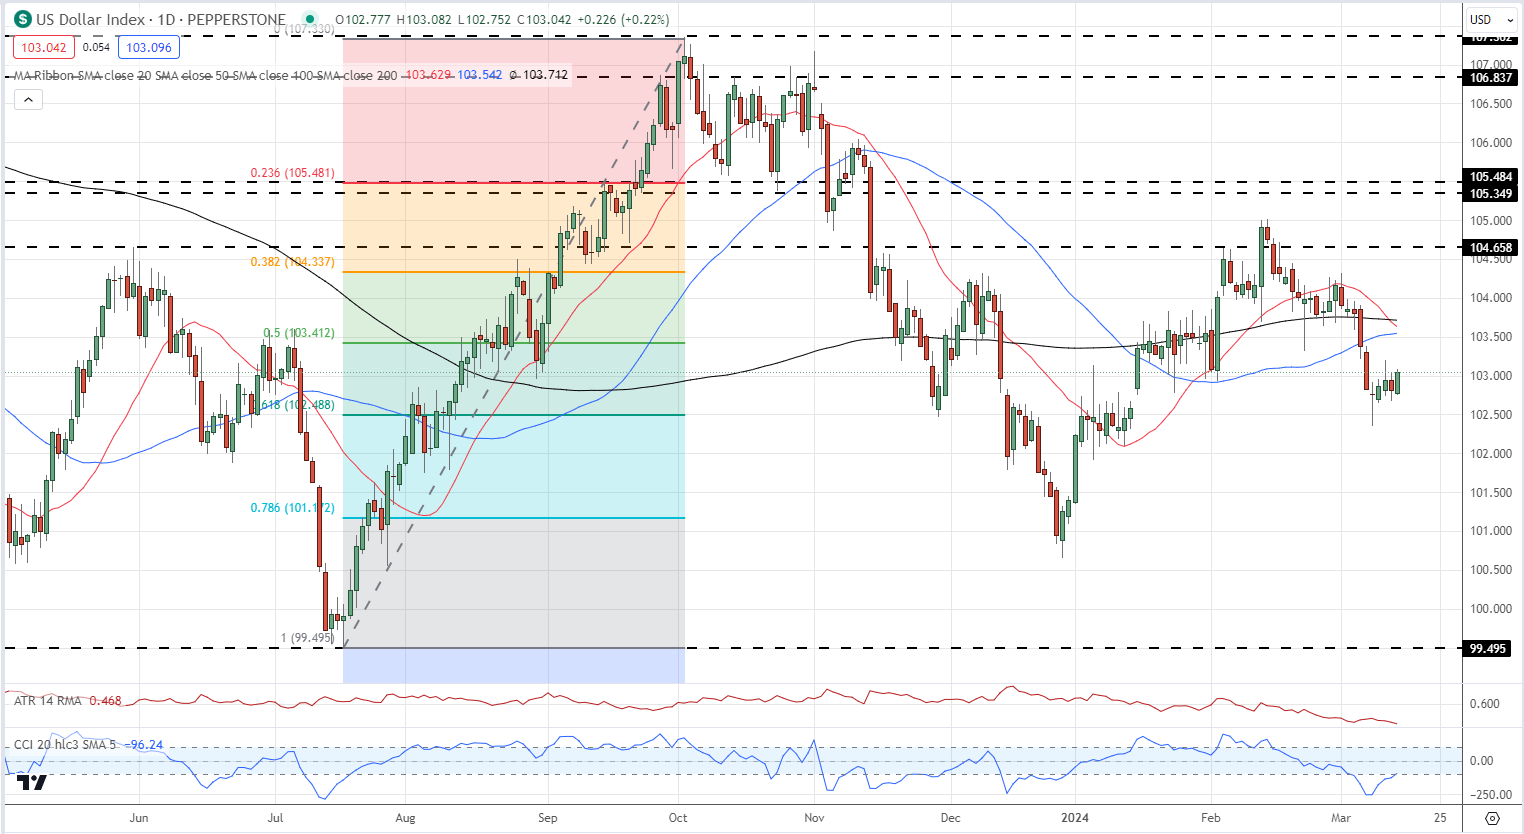
The net effect of today’s US data releases left the US dollar index trading on either of 103.00 in lackluster trade. The dollar has been stuck in a restrictive range this week ahead of next week’s FOMC meeting.
US Dollar Index Daily Chart
For all market-moving economic data and events, see the DailyFX Economic Calendar.
Recommended by Nick Cawley
Get Your Free Gold Forecast
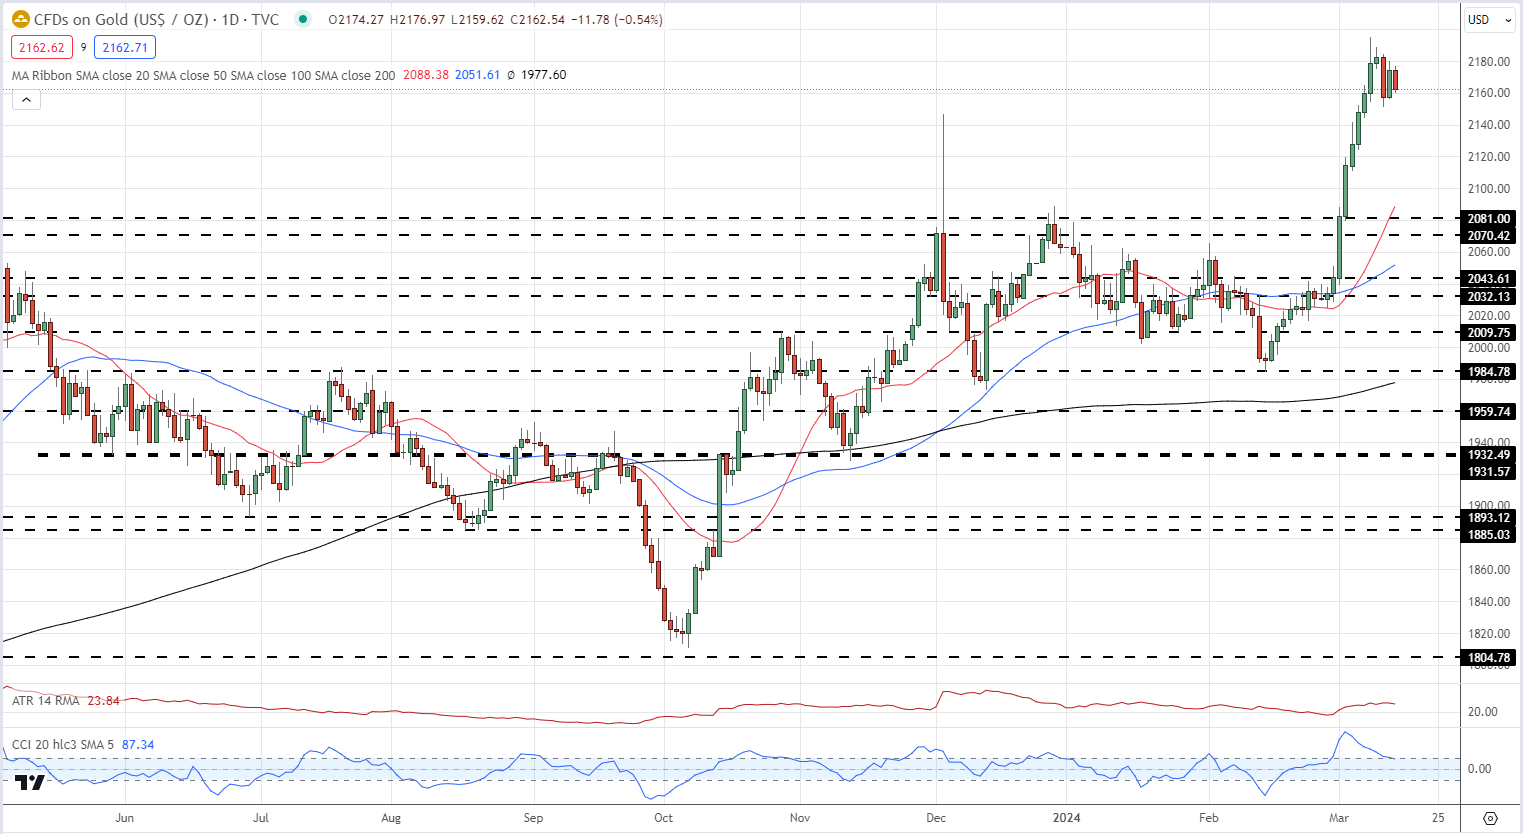
With the greenback barely moving, gold has found it difficult to make a move, one way or the other. This period of consolidation is starting to look like a new bullish pennant formation, although it will need another couple of candles to see if this plays out. If this pattern is formed, gold is likely to push further ahead and make a fresh record high. Support is seen at $2,148/oz. ahead of $2,128/oz.
Pennant Patterns: Trading Bullish and Bearish Pennants
Gold Daily Price Chart
Retail trader data show 40.95% of traders are net-long with the ratio of traders short to long at 1.44 to 1.The number of traders net-long is 1.53% higher than yesterday and 2.21% lower than last week, while the number of traders net-short is 1.91% higher than yesterday and 6.62% higher than last week.
We typically take a contrarian view to crowd sentiment, and the fact traders are net-short suggests Gold prices may continue to rise. See what these swings in positioning mean for the price of gold.
| Change in | Longs | Shorts | OI |
| Daily | -3% | -1% | -2% |
| Weekly | -6% | 1% | -2% |
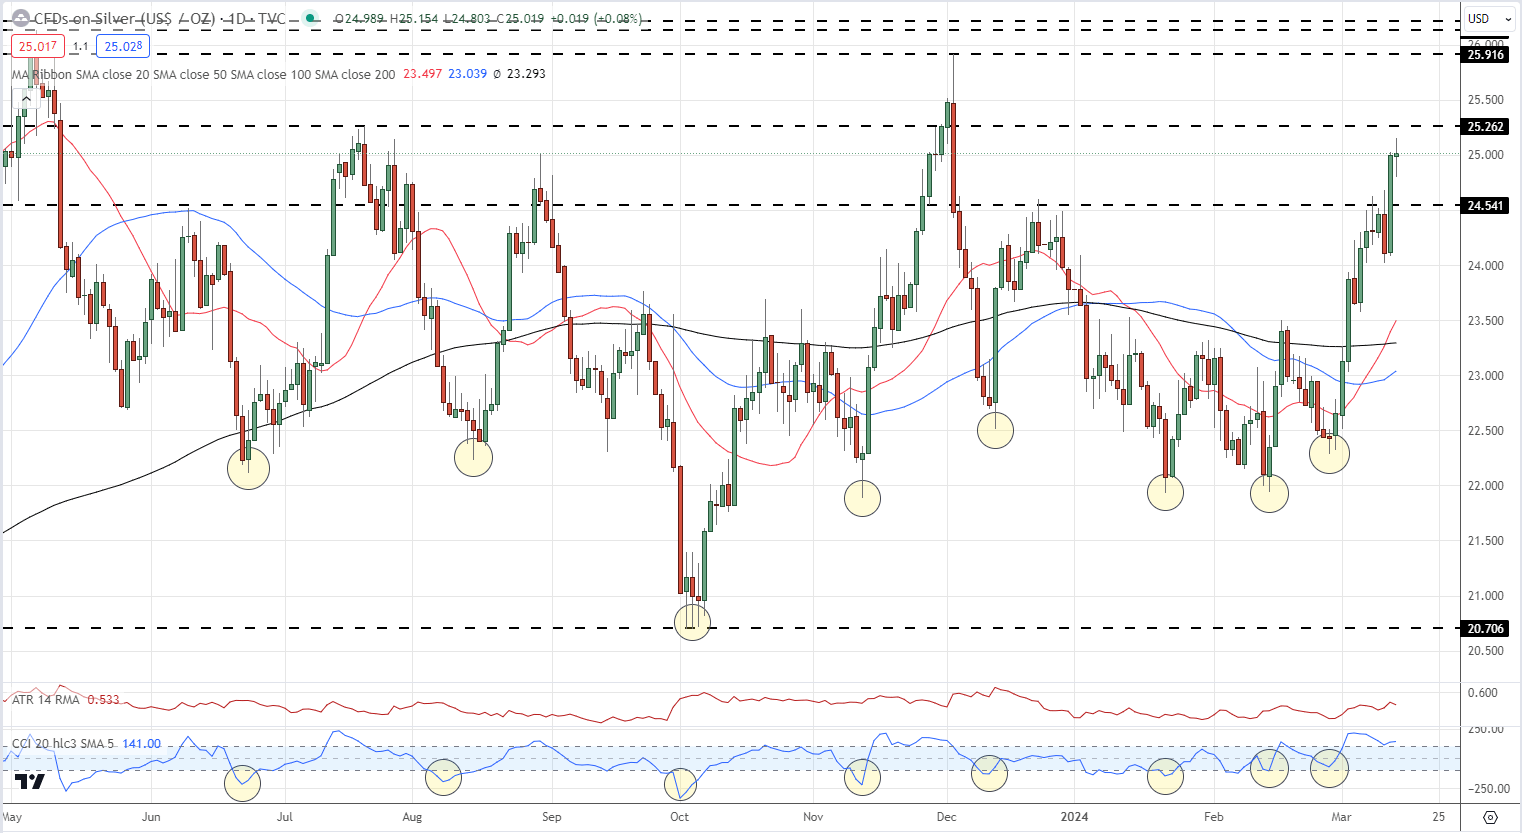
Silver has been on a roll since the end of February with yesterday’s sharp rise taking it to highs last seen in early December last year. We noted recently that the silver market had become heavily oversold using the CCI indicator, again highlighting a move higher in the precious metal. Resistance is seen at $25.26 ahead of $25.92 and this second level may prove difficult to overcome shortly. Initial support at $24.54.
Silver Daily Price Chart
What is your view on Gold and Silver – bullish or bearish?? You can let us know via the form at the end of this piece or you can contact the author via Twitter @nickcawley1.