For an extensive analysis of gold’s medium-term prospects, download our complimentary Q1 trading forecast now!
Recommended by Diego Colman
Get Your Free Gold Forecast
Most Read: US Dollar Forecast: USD/JPY Attacks Resistance as EUR/USD & GBP/USD Break Down
GOLD PRICE FORECAST – TECHNICAL ANALYSIS
Gold prices (XAU/USD) retreated on Monday, succumbing to the pressure of surging U.S. Treasury yields and a stronger U.S. dollar, following a string of solid U.S. economic data, including January non-farm payrolls and ISM services PMI. Comments from Federal Reserve policymakers that a rate cut in March is not likely also contributed to bullion’s decline.
From a technical standpoint, XAU/USD has slipped below its 50-day simple moving average after Monday’s pullback, but has managed to hold above horizontal support at $2,005. For sentiment towards the precious metal to improve, this technical floor must hold; if it doesn’t, sellers could become emboldened to initiate an attack on $1,990. On further weakness, attention turns to $1,975.
In the event of a bullish reversal in the coming days, which seems unlikely given the lack of positive catalysts and growing headwinds, the 50-day simple moving average at $2,032 will be the first line of defense against further advances. Looking further up, the next important ceiling stands at $2,065, followed by $2,085, the late December highs.
GOLD (XAU/USD) PRICE CHART
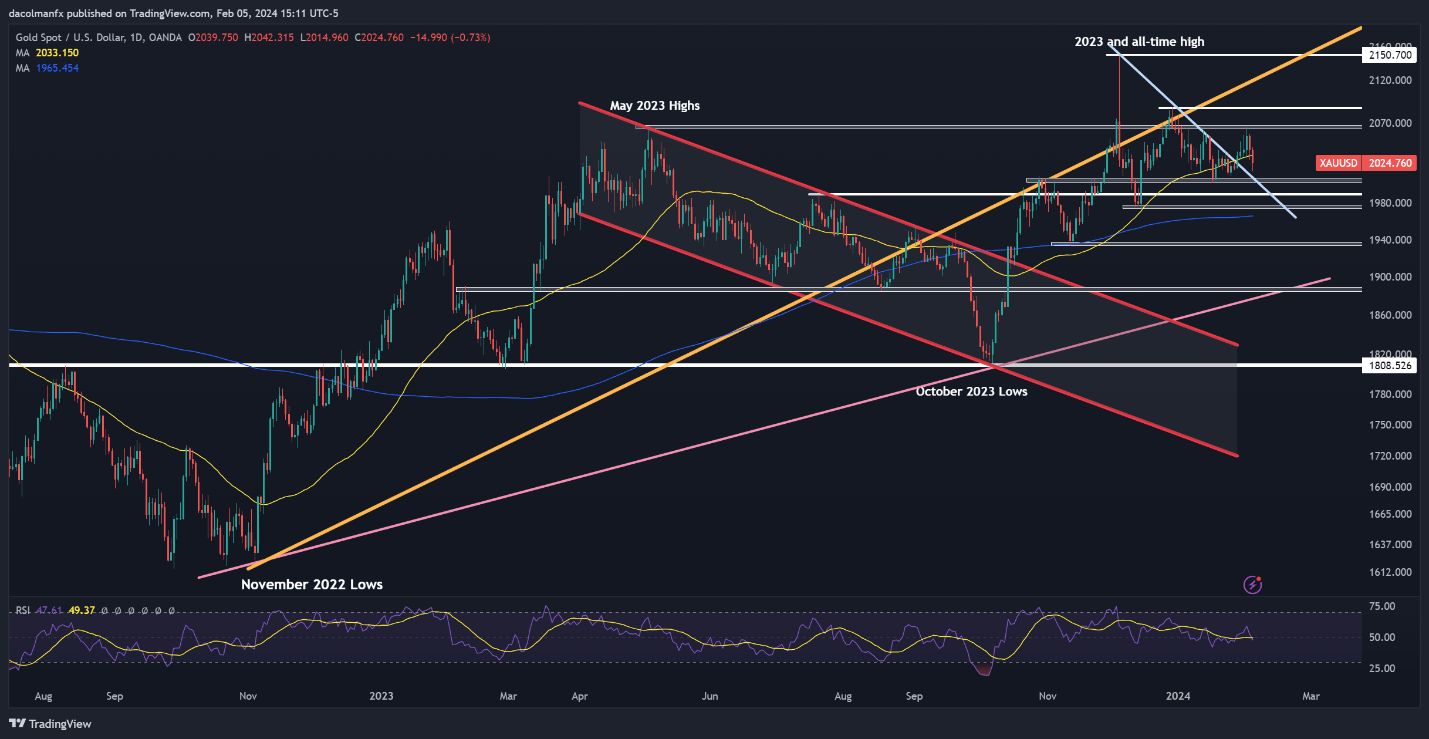
Gold Price Chart Created Using TradingView
Eager to gain a better understanding of where the oil market is headed? Download our quarterly trading forecast for enlightening insights!
Recommended by Diego Colman
Get Your Free Oil Forecast
CRUDE OIL PRICE FORECAST – TECHNICAL ANALYSIS
Crude oil (WTI futures) has fallen sharply in early February, erasing most of the previous month’s rally. However, prices appear to be stabilizing after bouncing off a short-term uptrend line extended from the December lows. If the bounce gains impetus in the coming days, initial resistance is positioned near $73.50 (50-day SMA), followed by $75.50.
On the other hand, should sellers regain control and succeed in driving oil prices below trendline support at $72.50 over the coming sessions, a retracement towards $69.35 should not be ruled out. The commodity is likely to bottom out in this area on a retest; however, a breakdown could exacerbate the bearish momentum, paving the way for a drop towards $67.25.
CRUDE OIL PRICE CHART
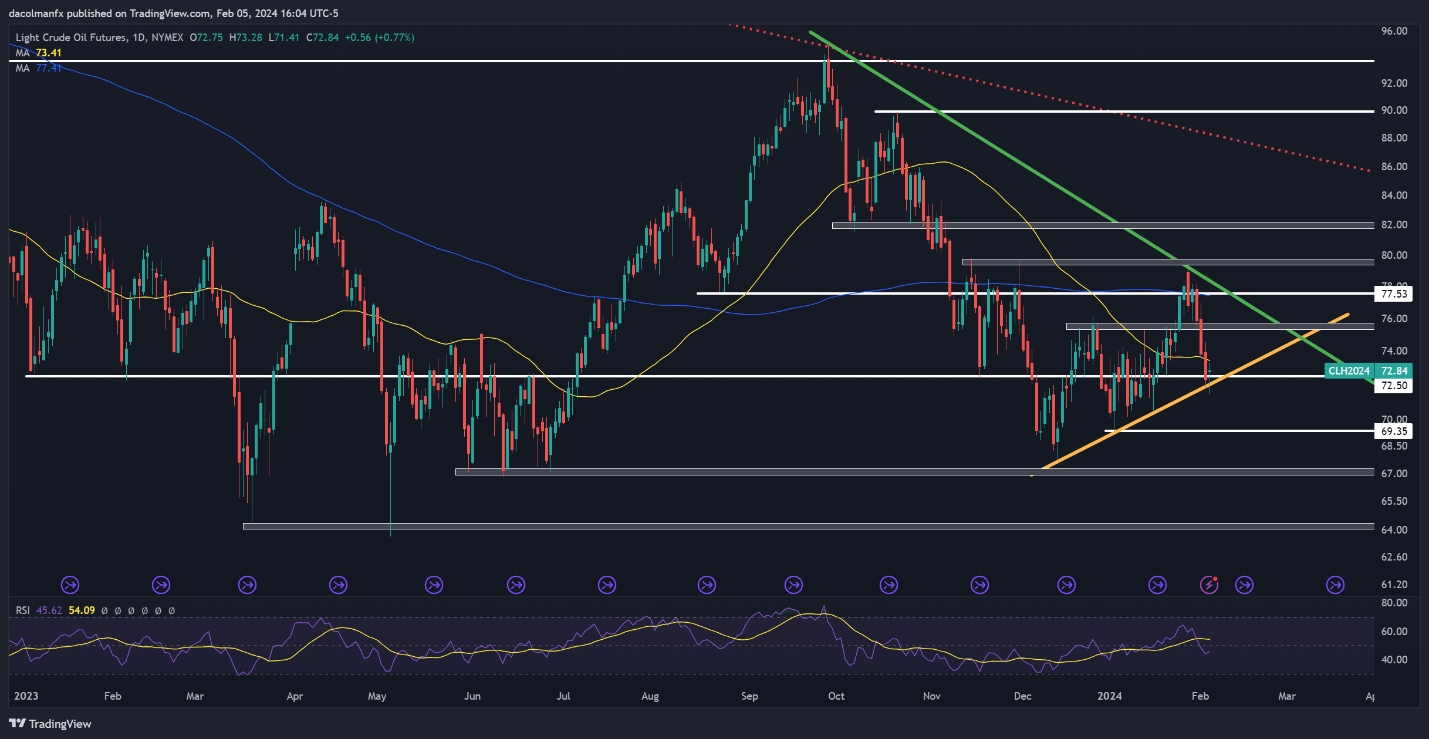
Crude Oil Price Chart Created Using TradingView
If you’re looking for an in-depth analysis of U.S. equity indices, our quarterly stock market trading forecast is packed with great fundamental and technical strategies. Get a free copy now!
Recommended by Diego Colman
Get Your Free Equities Forecast
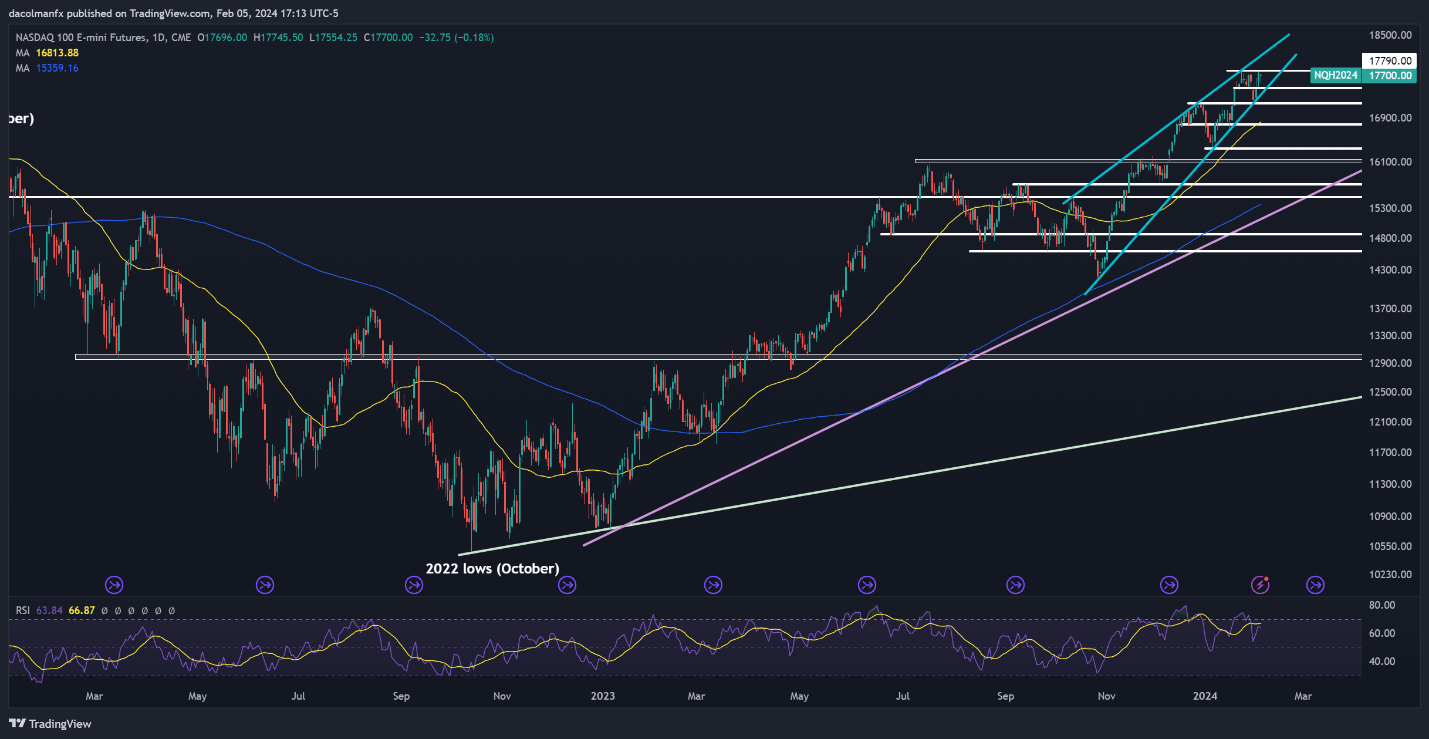
NASDAQ 100 FORECAST – TECHNICAL ANALYSIS
The Nasdaq 100 was largely directionless on Monday despite the surge in U.S. Treasury yields, with a few mega-cap names, such as Apple, Alphabet and Nvidia, holding up the entire market. Although the tech index remains entrenched within a solid uptrend, prices will struggle to move higher if yields extend their rebound, so traders should exercise caution going forward.
In terms of key technical thresholds, the first resistance to monitor resides in the vicinity of 17,800, which roughly coincides with the all-time highs. If buyers manage to take out this critical ceiling, a rally towards 18,050 may not be far off. On the flip side, if the Nasdaq 100 pulls back from its current position, support is seen at 17,450, followed by 17,185. On further weakness, the spotlight will center on 16,775.
Nasdaq 100 Chart