Nikkei 225, FTSE 100, and S&P 500 Prices and Analysis
The Nikkei 225 made yet another record high above the 40,000 mark
The Nikkei 225 has once more topped the psychological 40,000 mark, having already done so on Friday, boosted by tech/AI stocks like Tokyo Electron amid a shift towards tech nearshoring and foreign funds leaving Chinese stock markets for Japanese ones.
However, risks such as China’s economic fluctuations, potential yen strengthening, and changes in the Bank of Japan’s policy could impact the index’s upward trajectory as could the currently highly overbought levels of the index.
A minor retracement lower may take the Nikkei 225 back towards its 23 February high at 39,638 below which lies the 1989 previous record high at 38,957.
Nikkei 225 Daily Chart

Recommended by Axel Rudolph
Traits of Successful Traders
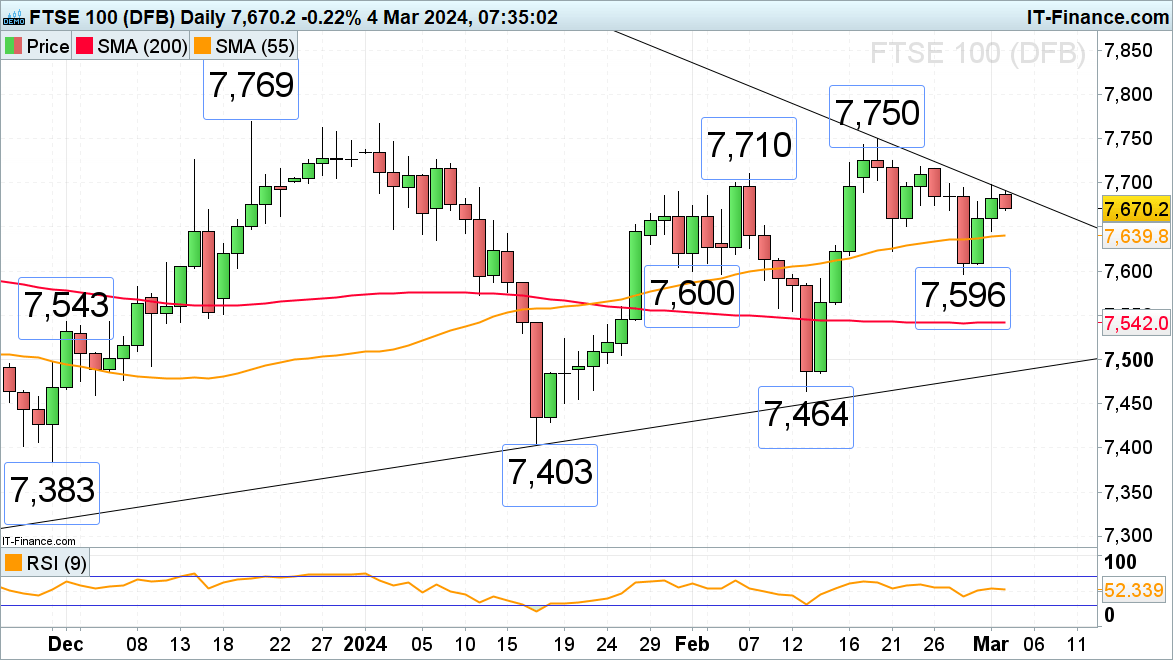
FTSE 100 is finding it difficult to reach the 7,710 to 7,769 region
The FTSE 100’s recovery from last week’s 7,596 low is finding it difficult to reach the early February high at 7,710. This level and the 23 February high at 7,717 need to be exceeded for the more significant 7,750 to 7,769 resistance area to be reached. It consists of the December-to-February highs.
Minor support sits between Friday’s low and the 55-day simple moving average (SMA) at 7,645 to 7,640.
FTSE 100 Daily Chart
| Change in | Longs | Shorts | OI |
| Daily | 32% | -5% | 11% |
| Weekly | 17% | -18% | -3% |
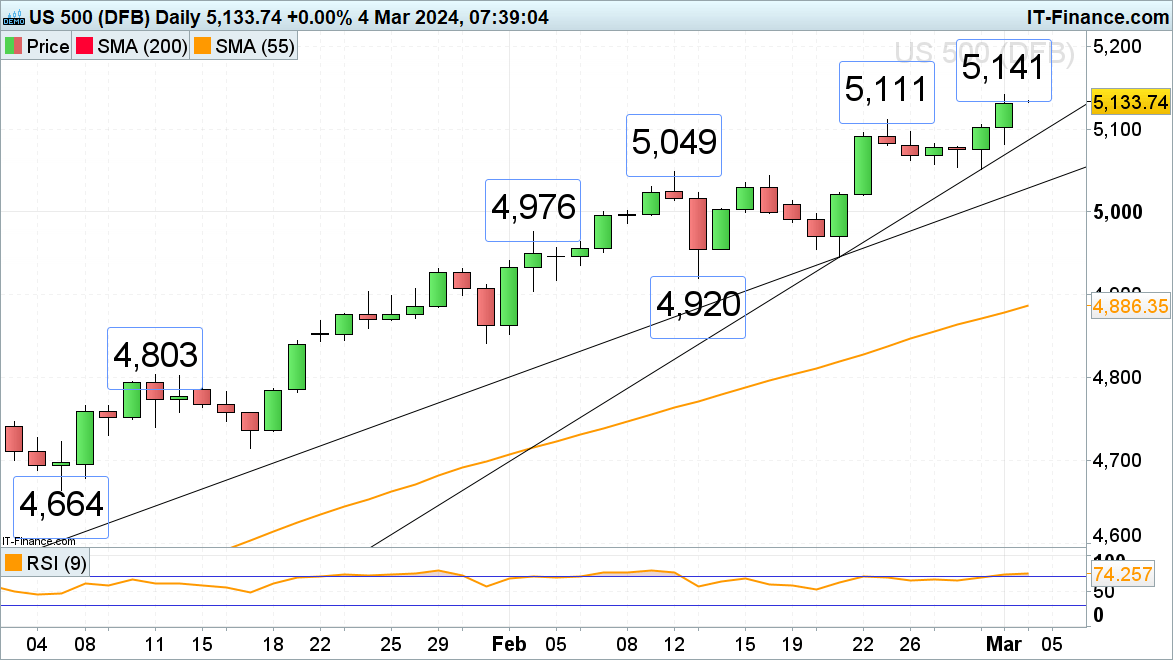
S&P 500 makes another record high
The S&P 500 surged higher again towards the end of last week and came close to the 5,150 region, hitting yet another record high ahead of this week’s Fed Chair Jerome Powell’s testimony and US labor data. Further up lies the 5,200 zone while support can be spotted around the 23 February high at 5,111.
Below it lies the February-to-March tentative uptrend line at 5,088.
S&P 500 Daily Chart