FTSE 100, S&P 500, and Nasdaq 100 Prices, Analysis, and Charts
FTSE 100 probes the 7,700 to 7,710 resistance area
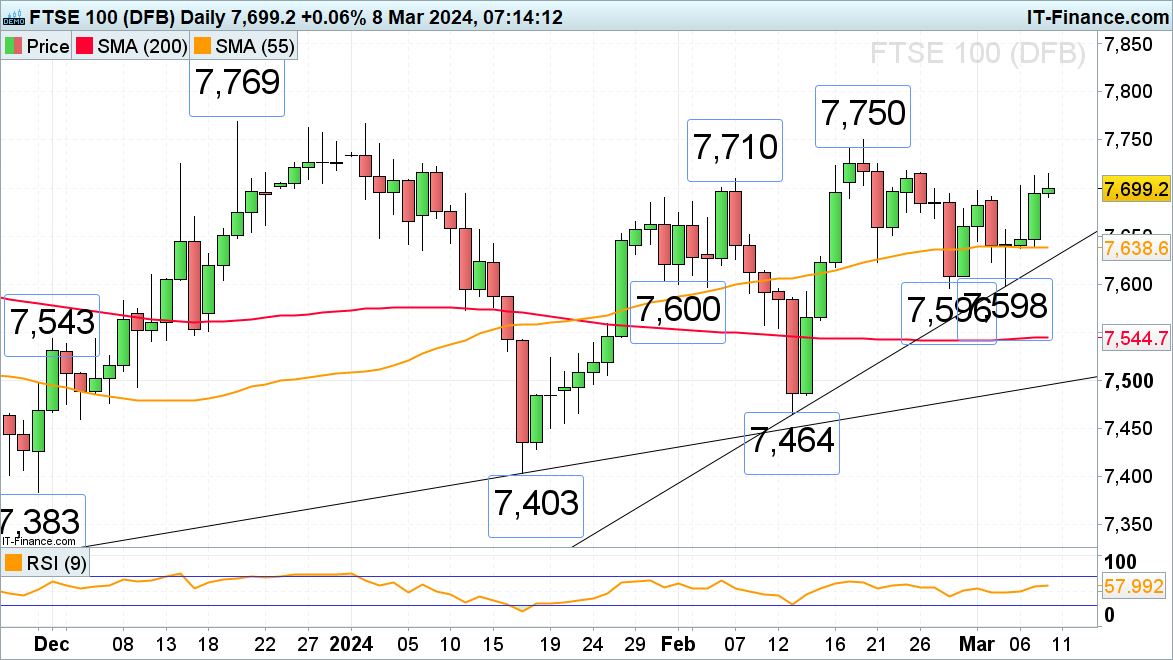
The FTSE 100 is benefitting from risk-on sentiment amid M&A activity, positive results, and summer rate cut expectations with it testing the 7,700 to 7,710 resistance zone which includes the early February high. If overcome, the 7,750 to 7,769 December and February highs will be next in line.
Support is seen along the 55-day simple moving average (SMA) at 7,639.
FTSE 100 Daily Chart
See how retail are positioned in the FTSE 100
| Change in | Longs | Shorts | OI |
| Daily | 29% | -21% | -2% |
| Weekly | 20% | -10% | 3% |
S&P 500 hits yet another record high
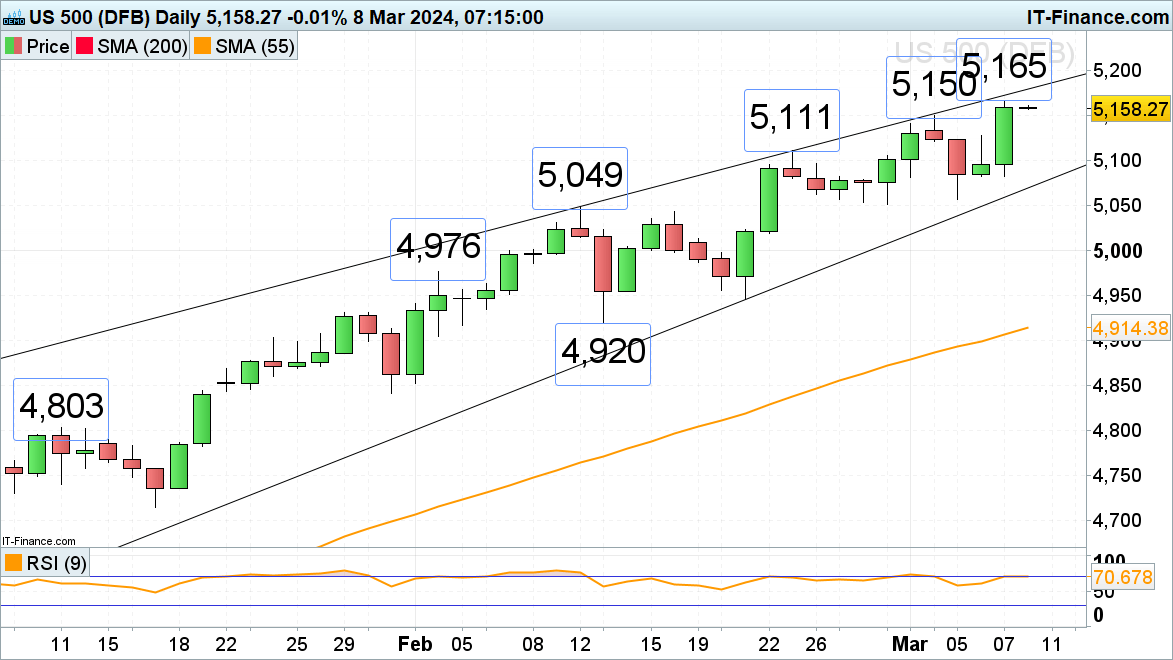
The S&P 500 surged higher again on rate cut expectations and risk on sentiment with it reaching yet another record high, this time at 5,165. Further up lies the 5,200 zone. Support can be found between Wednesday’s 5,128 high and the 23 February high at 5,111.
S&P 500 Daily Chart
Recommended by Axel Rudolph
The Fundamentals of Trend Trading
Nasdaq 100 heads back up towards a record high
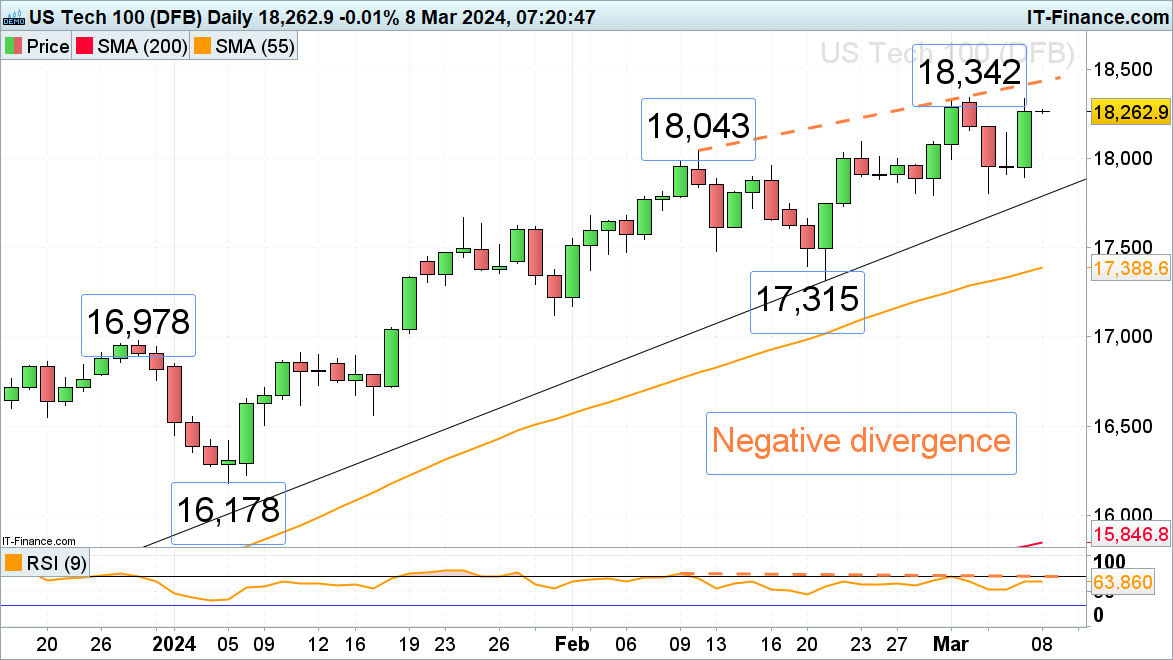
The Nasdaq 100’s sharp drop from Monday’s record high at 18,342 to Tuesday’s 17,805 low has been followed by another up leg which nears its peak with the 18,400 region being eyed amid Friday’s US Non-Farm Payrolls release.
The negative divergence seen on the daily RSI, whereby the oscillator didn’t confirm this week’s price record high, for the time being, remains in play, however.
Having said that, while Tuesday’s low at 17,805 underpins, the uptrend will remain intact.


