FTSE 100, Dow Jones, Nasdaq 100 Prices and Charts
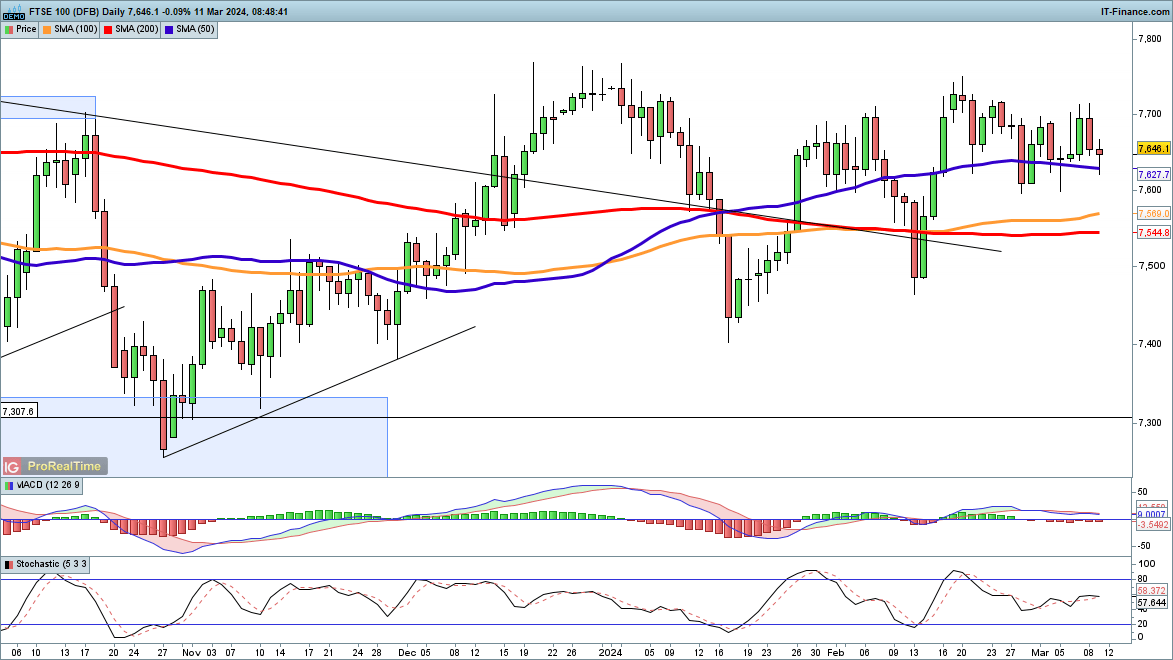
FTSE 100 fights to hold 50-day moving average
The past three weeks have seen the index drift back from its February high, with wide intraday swings indicating a hard-fought battle between buyers and sellers.
For the moment, the 50-day simple moving average (SMA) continues to provide support, halting any further decline in the short term. Selling last week petered out at 7600, so a close below this level would be a bearish development.In the short term, the 7700 and then 7770 levels are initial targets to watch in the event of a renewed move higher.
FTSE 100 Daily Price Chart
| Change in | Longs | Shorts | OI |
| Daily | 18% | -4% | 7% |
| Weekly | 8% | -8% | 0% |
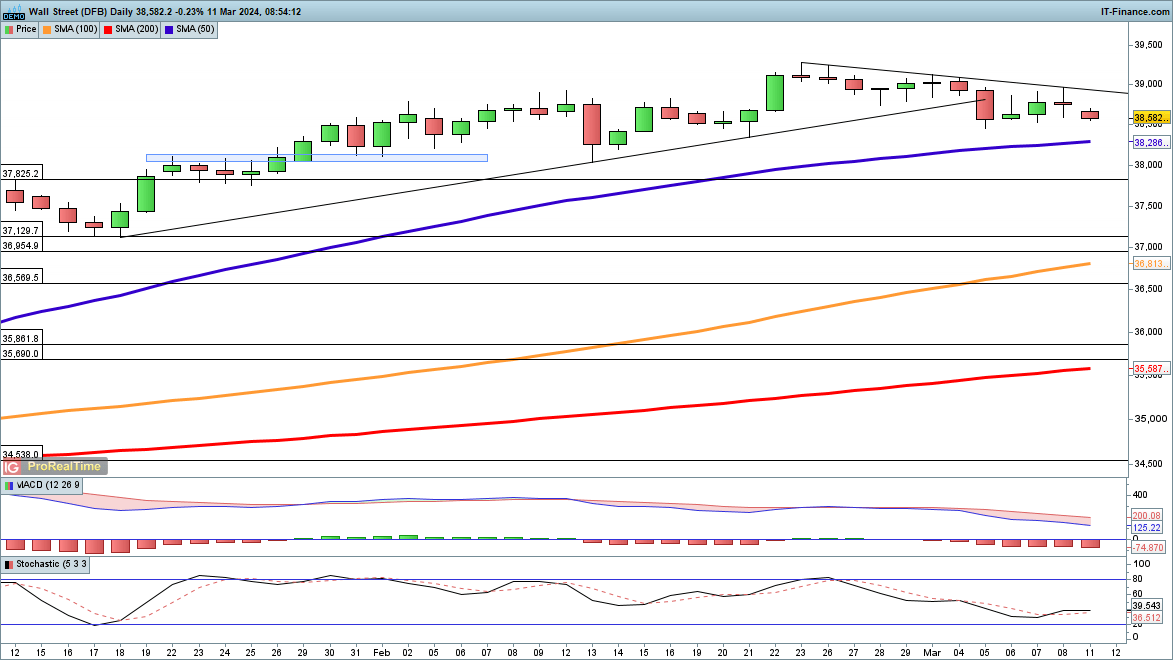
Dow eases back from record high
Bullish momentum has faltered here in the short-term. Friday’s attempted bounce ran out of steam at trendline resistance from the record high earlier in February.
A drop below last week’s low of 38,452 would then see the price test the 50-day SMA. The index has not touched the 50-day SMA since early November, a remarkable run. Below this lies the previous record high at 37,825.A close back above 39,000 might signal a break of trendline resistance, and open the way to the 39,287 highs from late February.
Dow Jones Daily Price Chart
Recommended by Chris Beauchamp
Traits of Successful Traders
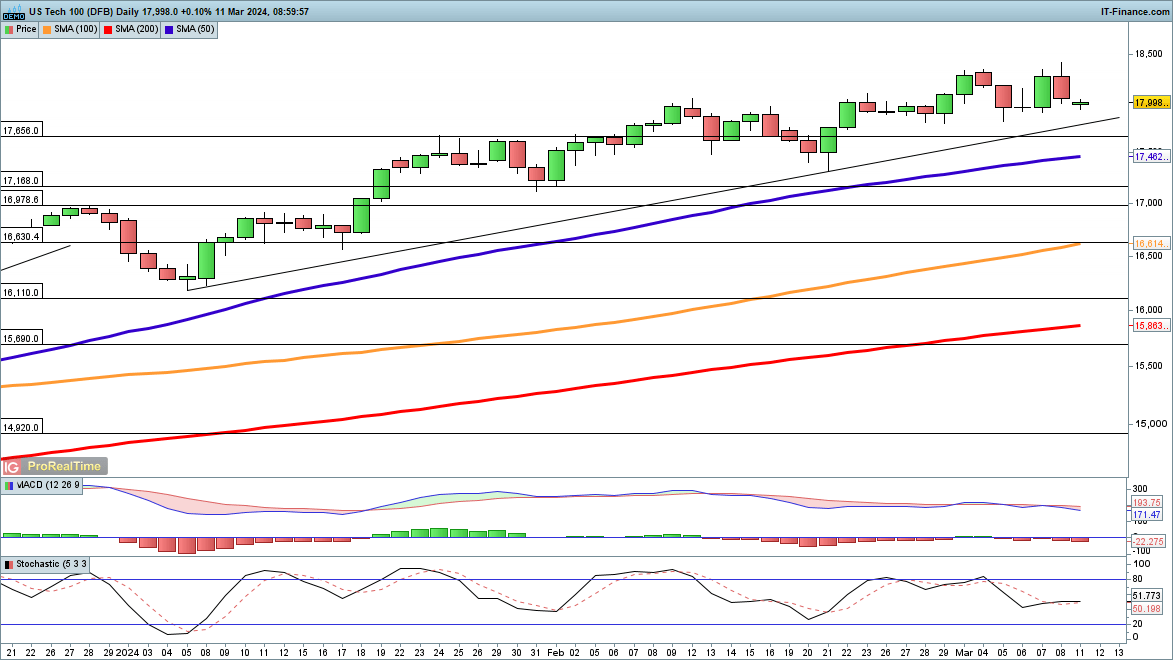
Nasdaq 100 stumbles
After hitting a record high on Friday, the index dropped back, with a sharp reversal for Nvidia stock sending shivers through the market.Further weakness may test rising trendline support from early January, while below this lies horizontal support at the previous record of 17,656. Beyond this comes the 50-day SMA – like the Dow, the Nasdaq 100 has not tested this indicator since early November.
Nonetheless, the price remains just over 2% from a record high, with a substantial pullback yet to materialise.
Nasdaq 100 Daily Price Chart