FTSE 100, CAC 40, S&P500 Analysis and Charts
FTSE 100 loses upside momentum
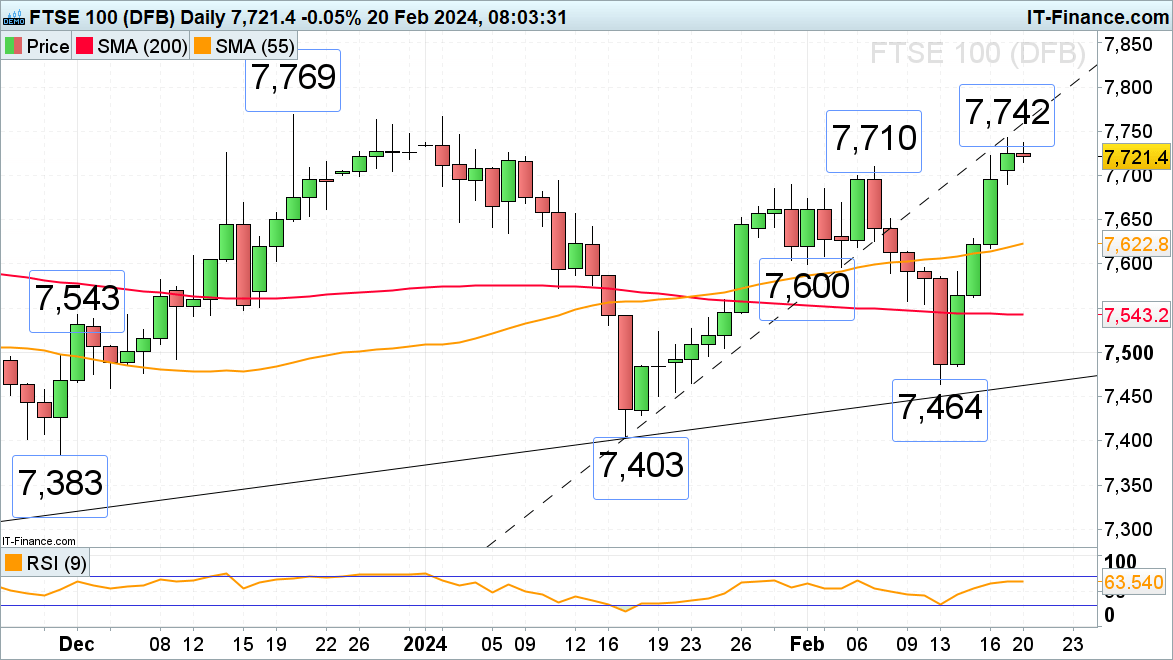
The FTSE 100’s swift rally off last week’s 7,464 low amid positive earnings, softer UK inflation, and much stronger-than-expected retail sales has taken the index to Monday’s 7,742 six-week high after four straight days of gains. Upside momentum is on the wane, though, as the index approaches its September peak at 7,747, above which beckons the 7,769 December peak.
Minor support sits at the early February 7,710 high and around the psychological 7,000 mark as well as at Monday’s 7,690 low.
FTSE 100 Daily Chart
Download our complimentary guise to help you boost your trading confidence
Recommended by Axel Rudolph
Building Confidence in Trading
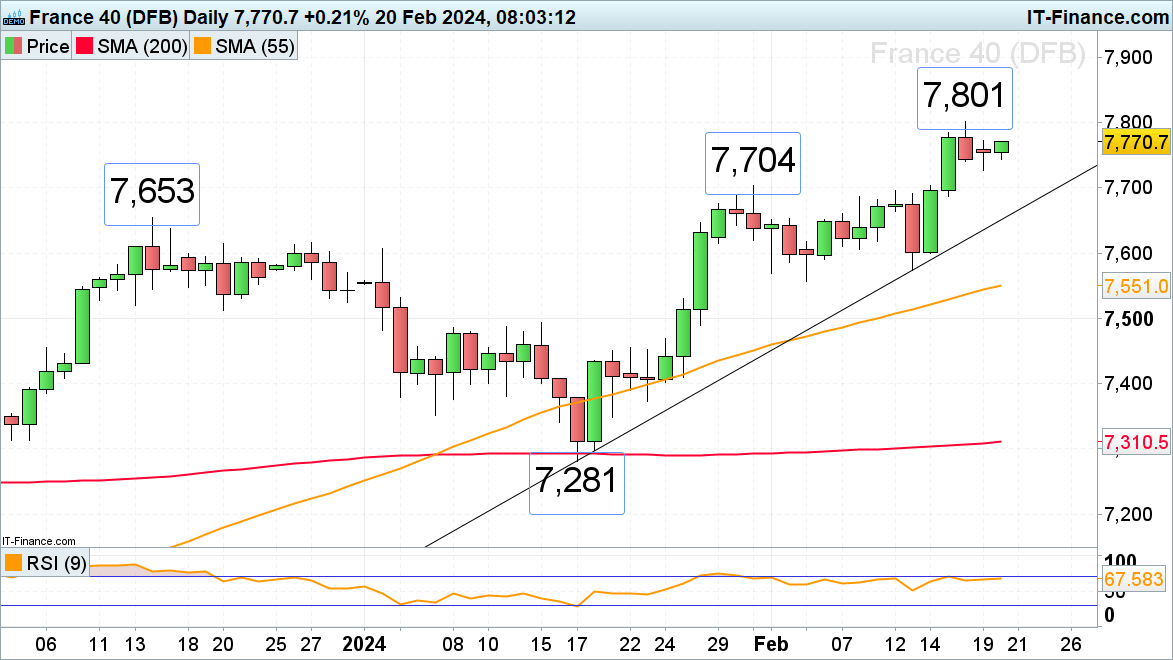
CAC 40 consolidates
The French CAC 40 stock index is trying to head back up towards last week’s 7,801 record high, having on Monday dipped to 7,728 on light volume as US markets were shut for Presidents’ Day. While this low underpins, further upside should remain in store.
A slip through 7,728 would engage the 7,704 January high below which lies the 7,653 December peak, both of which may act as support in the future.
CAC 40 Daily Chart
IG Retail Trader Data shows 13.56% of traders are net-long with the ratio of traders short to long at 6.38 to 1. The number of traders’ net long is 18.47% higher than yesterday and 6.29% higher than last week, while the number of traders’ net short is 1.72% higher than yesterday and 7.43% higher than last week.
| Change in | Longs | Shorts | OI |
| Daily | 8% | 0% | 1% |
| Weekly | 14% | 12% | 13% |
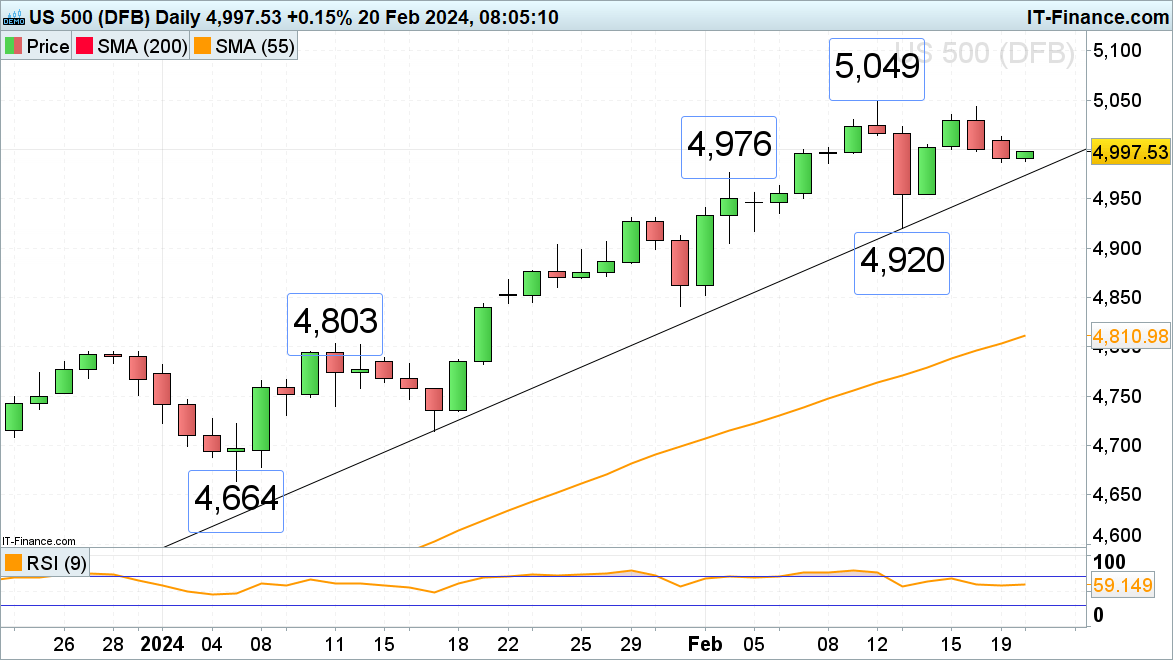
S&P 500 consolidates below record highs
The S&P 500 saw a few days of consolidation last week with the index now trading around the psychological 5,000 mark, having come off its current February 5,049 record high. While the 2024 uptrend line at 4,974 underpins, upside pressure should be maintained but the recent highs at 5,043 to 5,049 may thwart future attempts of a new all-time high being made. If overcome, however, the 5,100 region would be next in line.
Below the January-to-February uptrend line at 4,974 lies last week’s 4,920 low which needs to hold for the medium-term uptrend to remain valid.
S&P 500 Daily Chart