FTSE 100, DAX 40, Nasdaq 100 DailyCharts and Analysis
FTSE 100 rally pauses
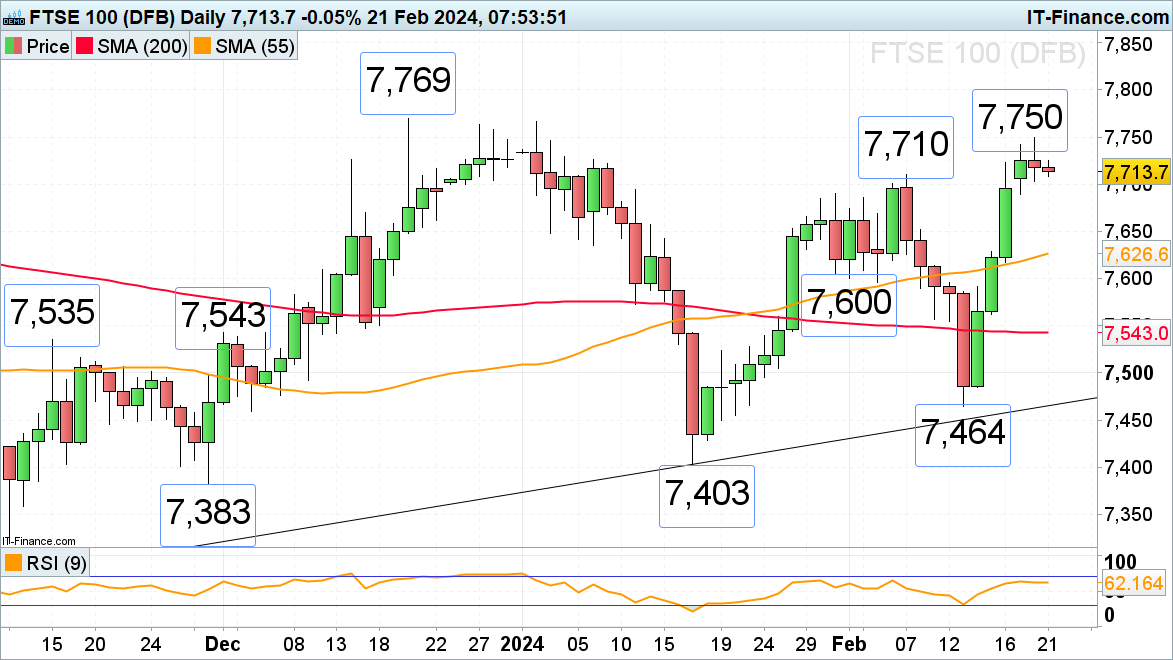
The FTSE 100’s rally off last week’s 7,464 low amid positive earnings, softer UK inflation, and much stronger-than-expected retail sales has taken the index to Tuesday’s 7,750 six-week high before consolidating.
The UK blue chip index has since then slid back below its September peak at 7,747 and may revisit minor support at the early February 7,710 high and around the psychological 7,000 mark ahead of Wednesday evening’s FOMC minutes. Perhaps even Monday’s 7,690 low may be revisited.
A rise above the 7,747 to 7,750 resistance zone would put the 7,769 December peak on the cards.
FTSE 100 Daily Chart
| Change in | Longs | Shorts | OI |
| Daily | 58% | -29% | -1% |
| Weekly | -21% | 47% | 2% |
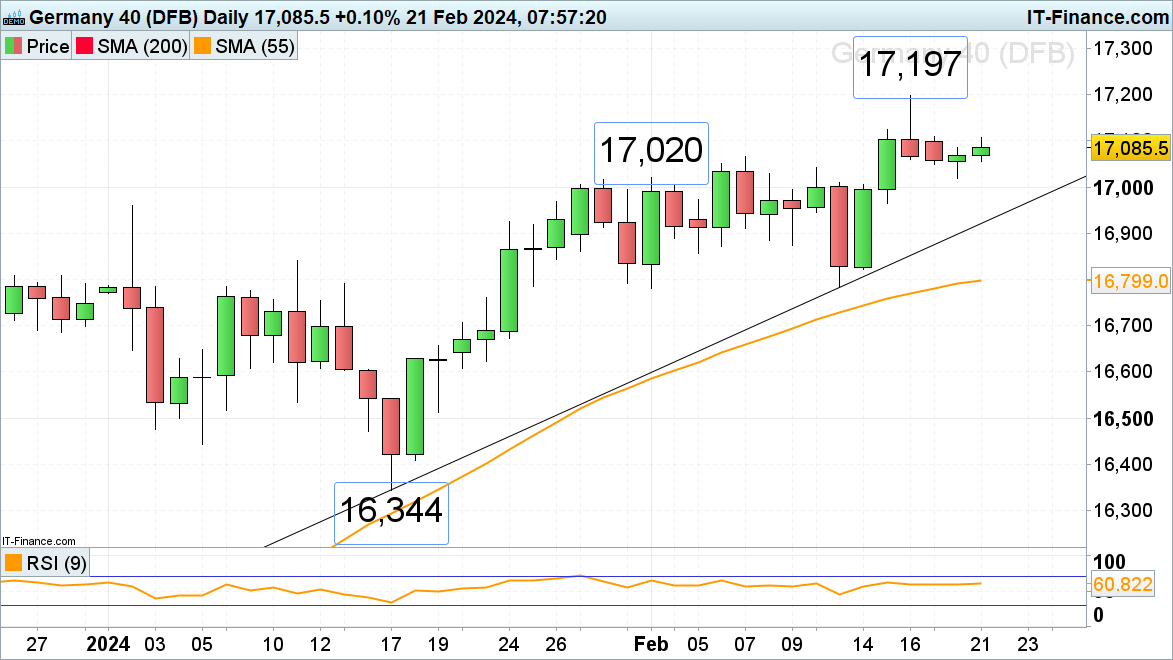
DAX 40 still range trades in low volatility below last week’s record high
The DAX 40 index continues to sideways trade in low volatility below last week’s record high at 17,197 and on Tuesday dipped to its 17,020 low from which it is rising once again. Minor resistance above Monday’s 17,109 intraday high can be found at Thursday’s 17,123 high.
If the 17,020 low were to give way, at least a minor top would be formed with the psychological 17,000 mark being next in line.
DAX 40 Daily Chart
Recommended by Axel Rudolph
Get Your Free Equities Forecast
Nasdaq 100 drifts lower ahead of Nvidia earnings
The Nasdaq 100 remains under pressure ahead of this evening’s after-hours Nvidia earnings, having slid for the past three consecutive days to Tuesday’s 17,396 three-week low. Failure there would likely push the 17,119 late January low to the fore.
While 17,396 holds, though, a rise back towards Monday’s 17,609 low may ensue, above which good resistance can be spotted between the late January and early February highs at 17,668 to 17,681.


