FTSE 100, DAX 40, Nasdaq 100 Prices and Charts
FTSE 100 consolidates below last week’s ten-month high
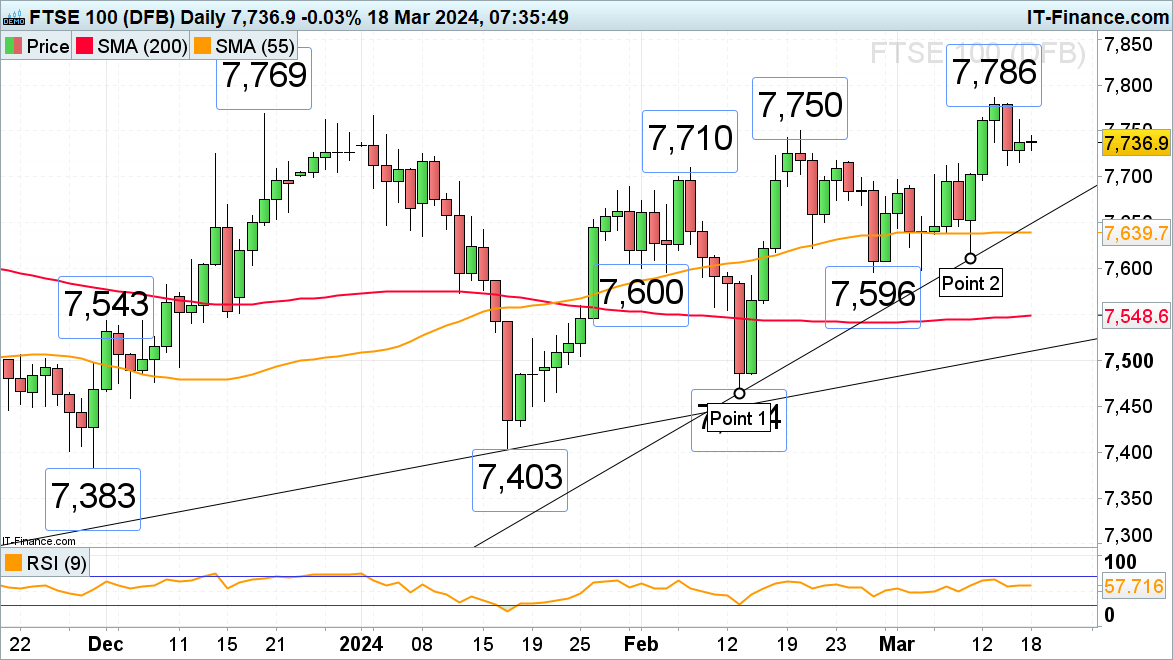
The FTSE 100’s rally to its 7,786 ten-month high, made last week, has been followed by a minor consolidation phase below this level as investors await the Bank of England’s (BoE) interest rate decision and monetary policy commentary on Thursday.
Strong resistance remains to be seen between the 7,747 to 7,769 September to December highs ahead of last week’s 7,786 peak. Support is found at last week’s 7,713 low as well as at the 7,710 to 7,702 October and early February highs.
FTSE 100 Daily Price Chart
| Change in | Longs | Shorts | OI |
| Daily | 15% | 5% | 9% |
| Weekly | -29% | 45% | 4% |
DAX 40 consolidates below its record high
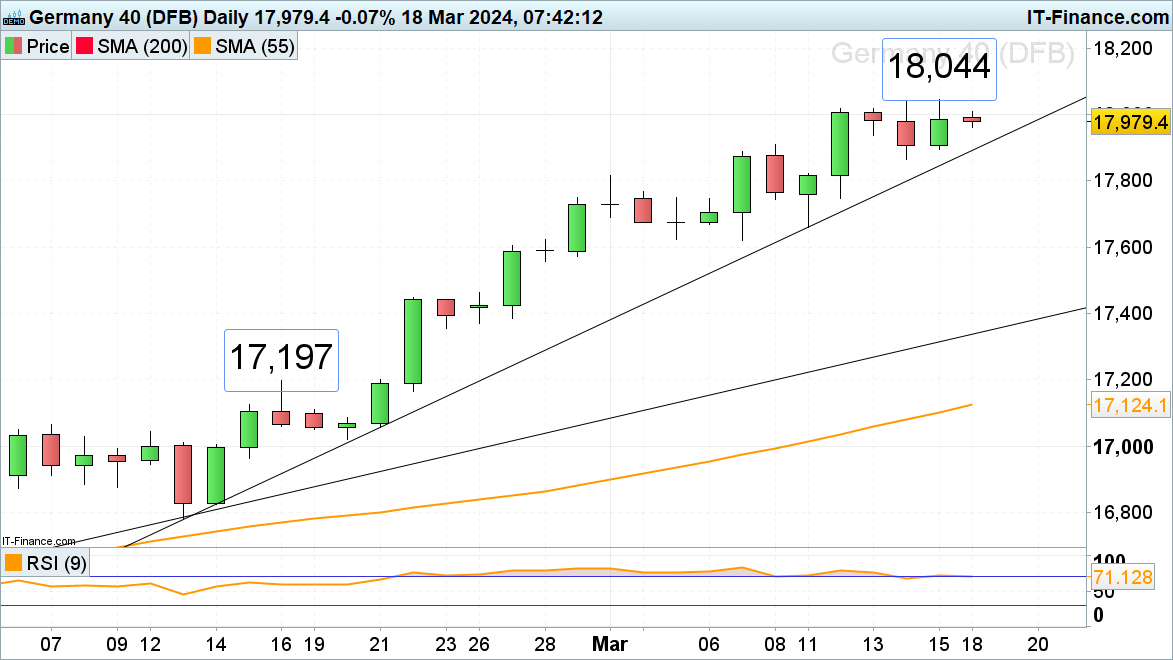
The DAX 40’s advance to above the minor psychological 18,000 mark to last week’s new record high close to 18,050 remains in play ahead of Tuesday’s German ZEW March economic sentiment indicator release.
Above 18,050 lies the 18,200 region which remains in focus while the February-to-March accelerated uptrend line at 17,892 underpins, together with Thursday’s low at 17,865.
DAX 40 Daily Price Chart
Recommended by Axel Rudolph
Building Confidence in Trading
Nasdaq 100 hovers above near one-month low
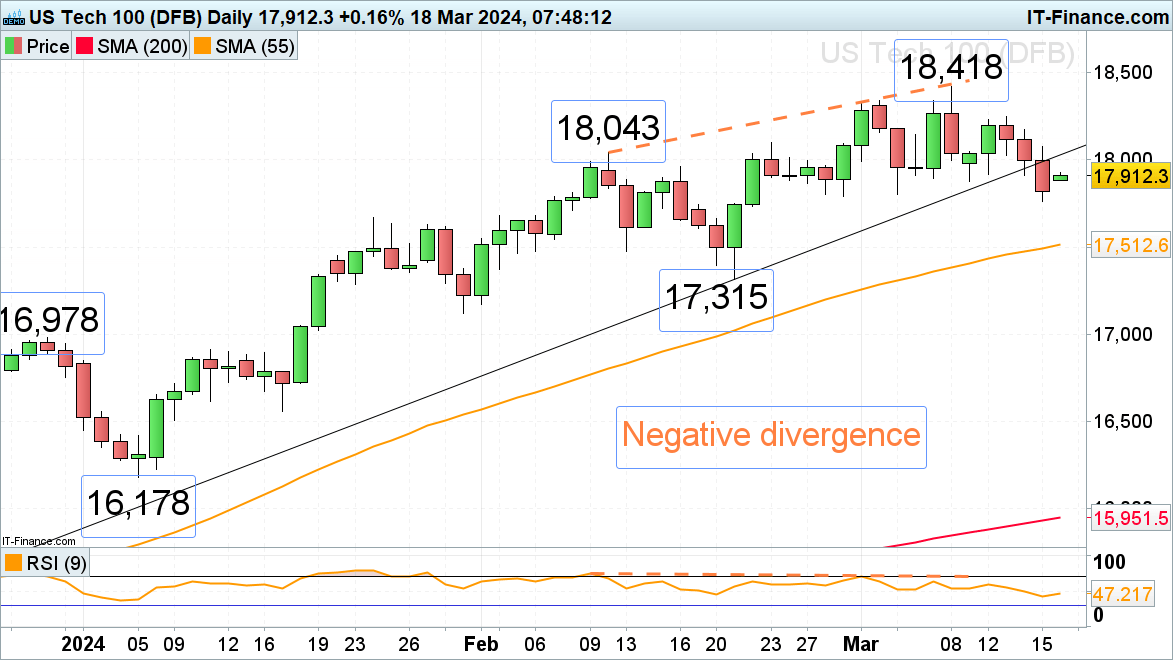
The Nasdaq 100’s gradual corrective move lower from its 8 March 18,418 record high last week took it to a near one-month low at 17,762 above which it is expected to hover ahead of Wednesday’s Federal Open Market Committee (FOMC) meeting.
If not, a medium-term top formation will be formed with the late January high at 17,668 being in focus.
Resistance can be spotted along the breached October-to-March uptrend line at 18,032 which, because of inverse polarity, should now act as a resistance line.


