Dow Jones, Hang Seng, Nikkei 225
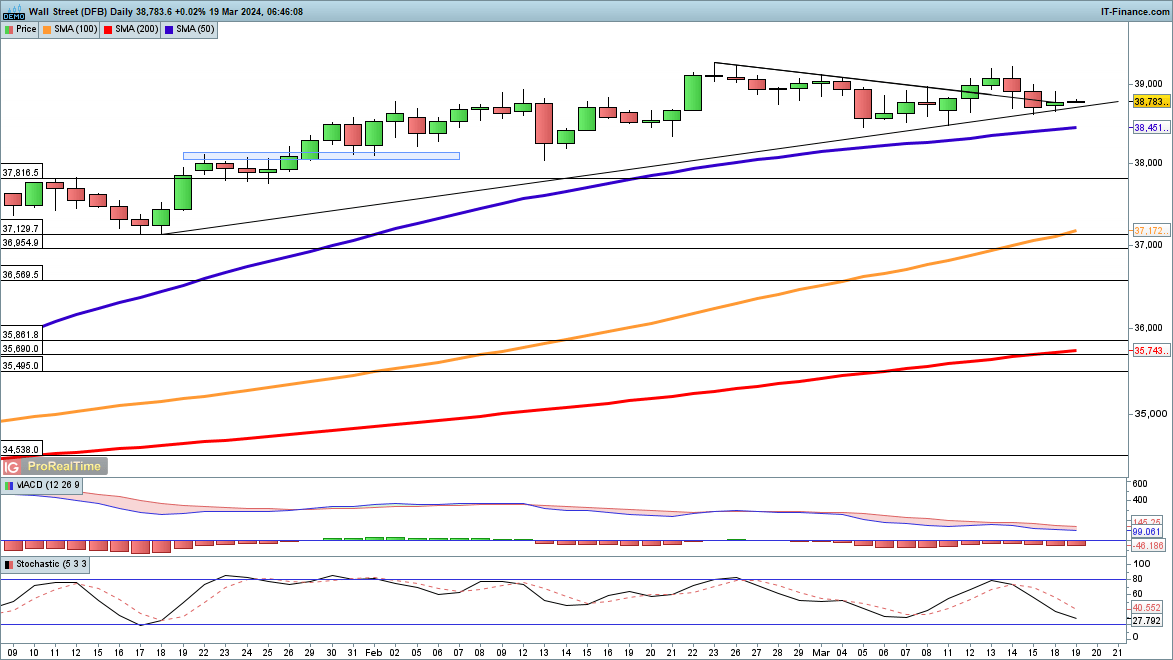
Dow steady in early trading
The index held trendline support on Monday, though it finished off the highs.Nonetheless, the price has yet to break lower in a meaningful way. Investors are likely waiting to see what the Fed rate decision brings in terms of any changes to the rate forecasts for the year.
A close below trendline support opens the way to the 50-day simple moving average (SMA), and then down to the previous high at 37,816.
Dow Jones Daily Price Chart
| Change in | Longs | Shorts | OI |
| Daily | 46% | -10% | -1% |
| Weekly | -16% | 10% | 2% |
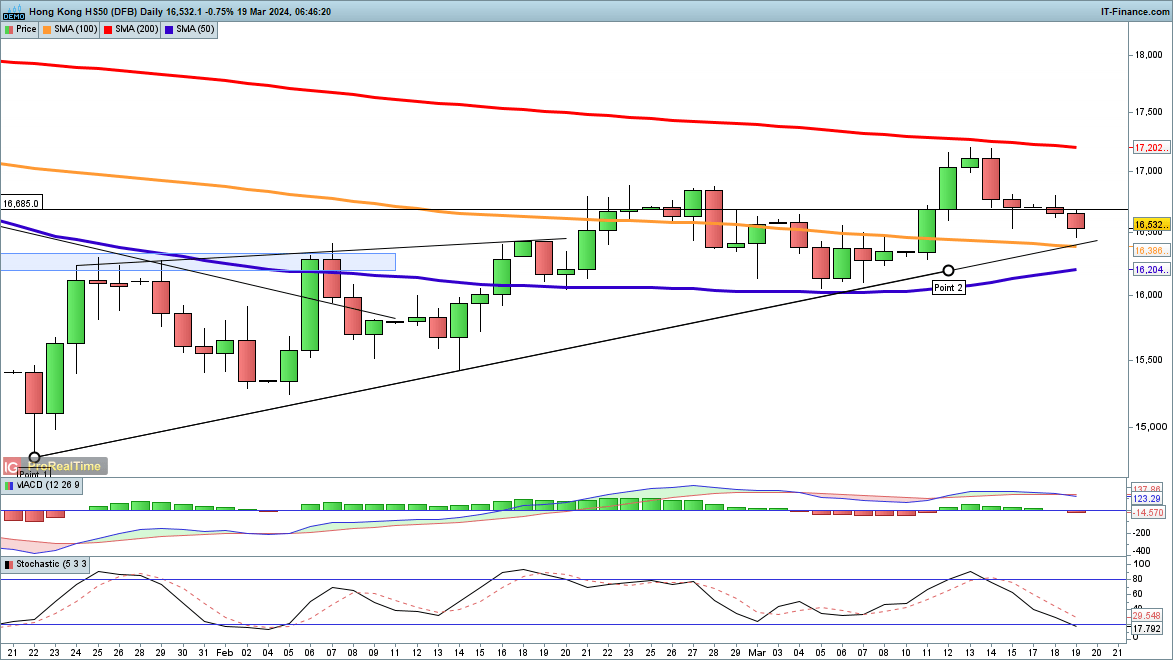
Hang Seng heads towards support
After rebounding in the early part of last week some bullish momentum has faded, but the price remains above trendline support from the January low.This would need to be broken to provide a more solid foundation for a bearish view, as would a move below the early March low of around 16,100.
Hang Seng Daily Price Chart
Recommended by Chris Beauchamp
Building Confidence in Trading
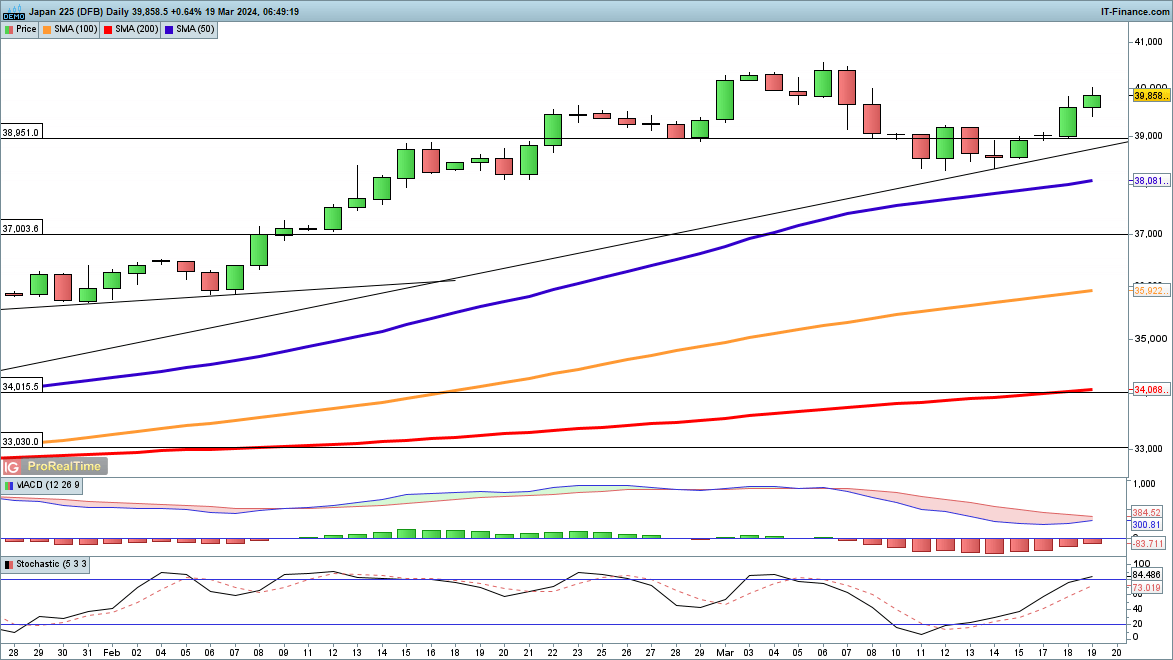
Nikkei 225 rallies after Bank of Japan decision
It would have required a much more hawkish Bank of Japan (BoJ) decision to unsettle the Nikkei 225.As it was, the move out of negative interest rates had been well-telegraphed. The index continued to rally, maintaining the bounce-off trendline support from January, and heading back towards 40,000.
Further gains target the 6 March high at 40,574, and beyond this, the index will sit at a new record high. It would require a reversal and closeback below trendline support to negate this view.
Nikkei 225 Daily Price Chart