Dow Jones, Nasdaq 100, Nikkei 225 – Prices, Analysis, and Charts
Dow breaks higher
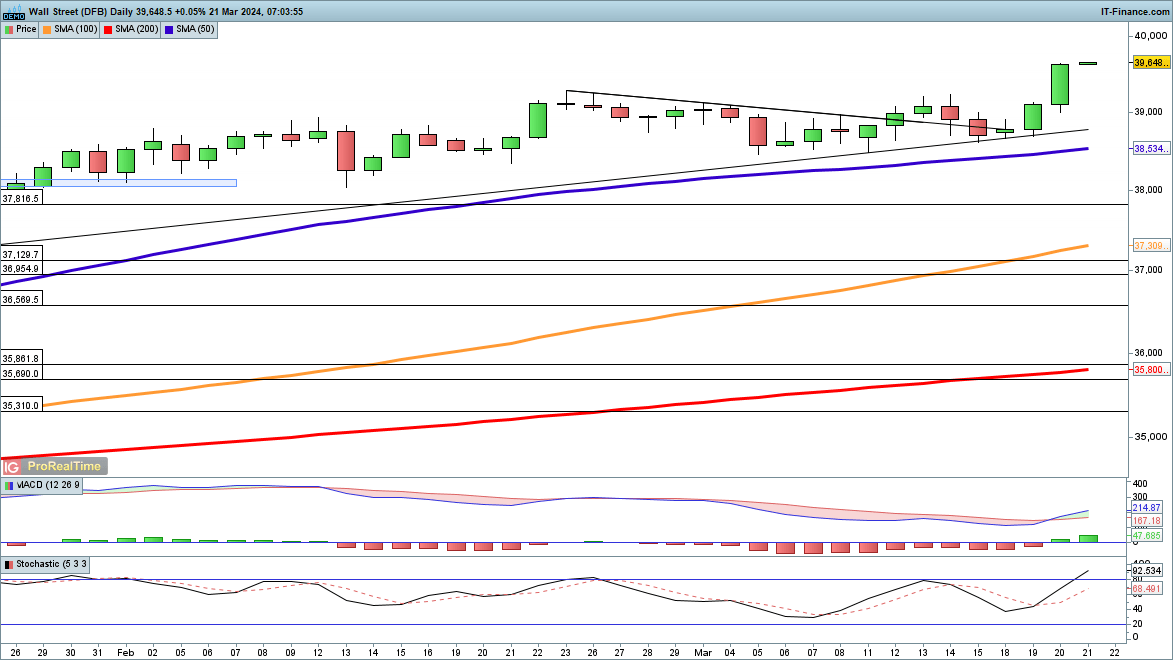
Yesterday saw the index rally in the wake of the Fed decision, and a new all-time high was created.
Trendline support from mid-January continued to hold, and the price was able to push back above 39,000. The next target would be 40,000, which could provide some psychological resistance as a large round number.
Dow Jones Daily Price Chart
See how shifting client sentiment can affect underlying price action
| Change in | Longs | Shorts | OI |
| Daily | -1% | 1% | 1% |
| Weekly | -32% | 14% | 2% |
Nasdaq 100 is poised to break to a new record
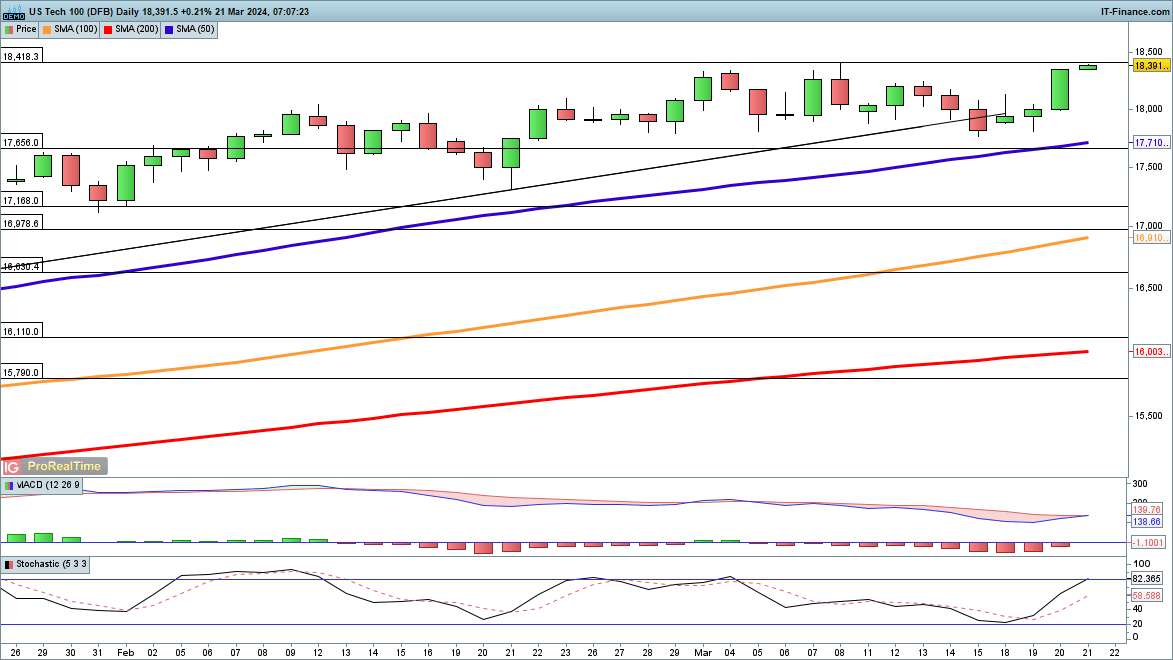
This index also made gains after the Fed meeting, continuing its recovery from last week’s lows.A test of the previous high at 18,418 is now likely, with the bullish view firmly back in place. Beyond this lies new record highs.
In the short term, support might be found at the 50-day simple moving average (SMA) in the event of a pullback.
Nasdaq 100 Daily Price Chart
Recommended by Chris Beauchamp
Traits of Successful Traders
Nikkei 225 hits a fresh peak
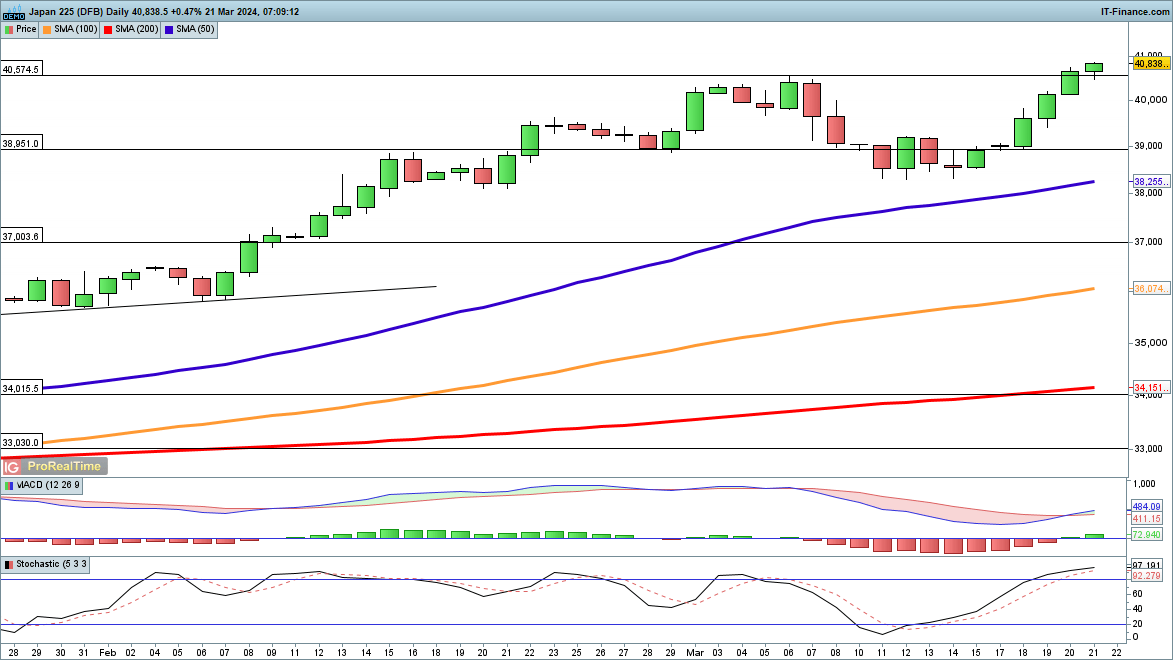
The Nikkei 225 continued its strong run for the week, pushing on towards 41,000. A new record high has been created, as the recovery from the higher low of mid-March continues. This has put fresh strength into the uptrend, cancelling out any bearish view for the time being.


