Dow Jones, Nasdaq 100, Hang Seng Analysis and Charts
Dow eases back from Friday’s high
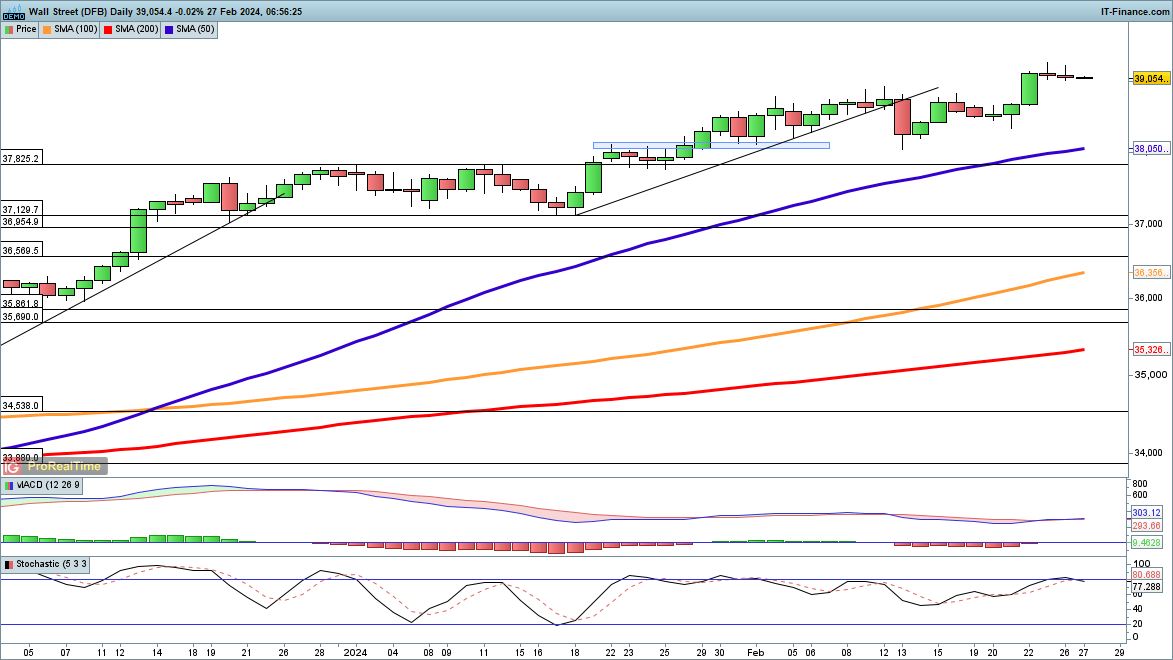
The index touched a record high on Friday, though it failed to hold its gains. Monday’s session saw the index struggle too, though it remains close to the record high. In the short-term, a drop below last Wednesday’s low at 38,335 would suggest a possible test of the 50-day simple moving average (SMA).
Below this lies the previous peak of 37,825, and then down to the mid-January low of 37,129.
Dow Jones Daily Chart
Recommended by Chris Beauchamp
Get Your Free Top Trading Opportunities Forecast
Nasdaq 100 falters close to record high
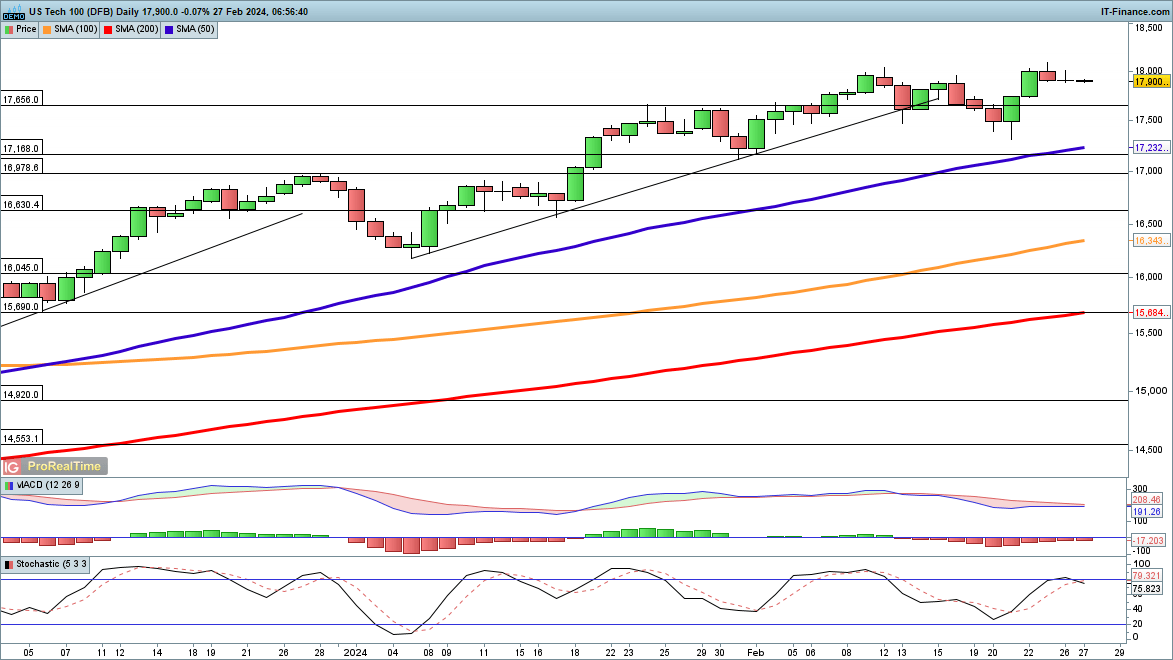
The situation is similar for the Nasdaq 100, which also hit a record high on Friday before dropping back into Monday’s session. An attempted rally on Monday fizzled out, which may set the stage for a test of last week’s low at 17,314, and then down to the 50-day SMA, which has not been tested since the rally began back at the end of October.
A close above 18,000 puts the price on an upward path once more.
Nasdaq 100 Daily Chart
Recommended by Chris Beauchamp
Traits of Successful Traders
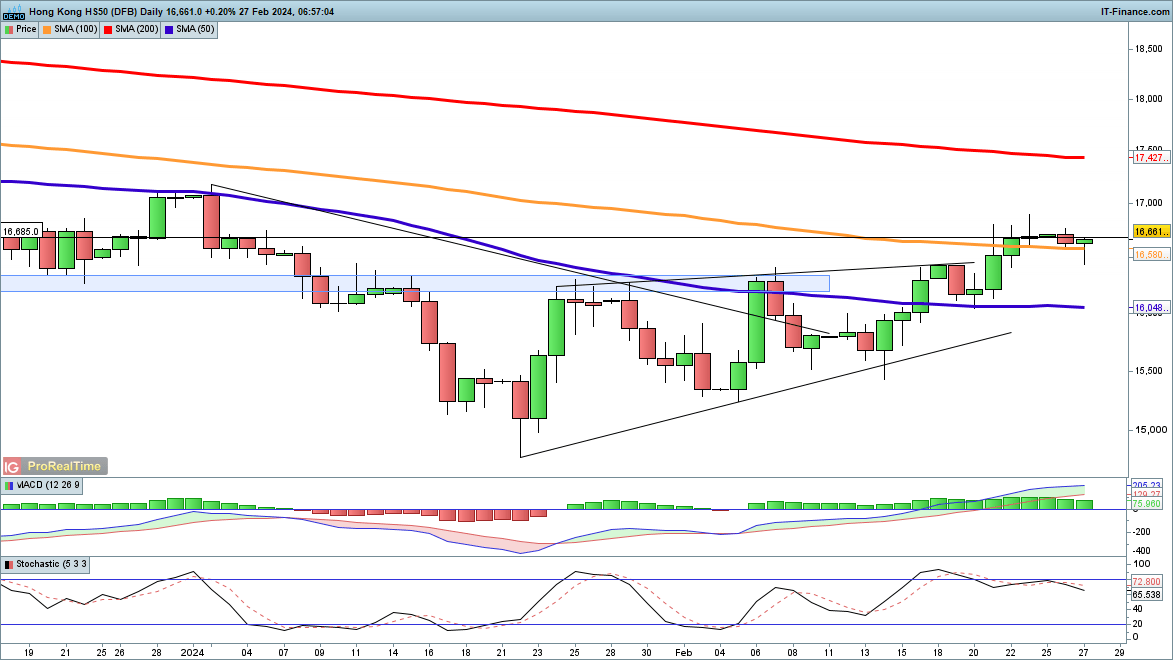
Hang Seng sits above 100-day MA
The index’s rally has carried above the 100-day SMA for the first time since mid-November.Gains have begun to falter, however, and a close back below the 100-day SMA, along with a bearish MACD crossover, could signal that a lower high is in place. The downtrend is still intact, even aftera 14% rally from the January low.
The price has yet to move above the previous lower high from late December, around 17,120, so until this happens the bearish outlook remains.
Hang Seng Daily Chart