Dow Jones, Nasdaq 100, Nikkei 225 Prices and Charts
Dow finds support
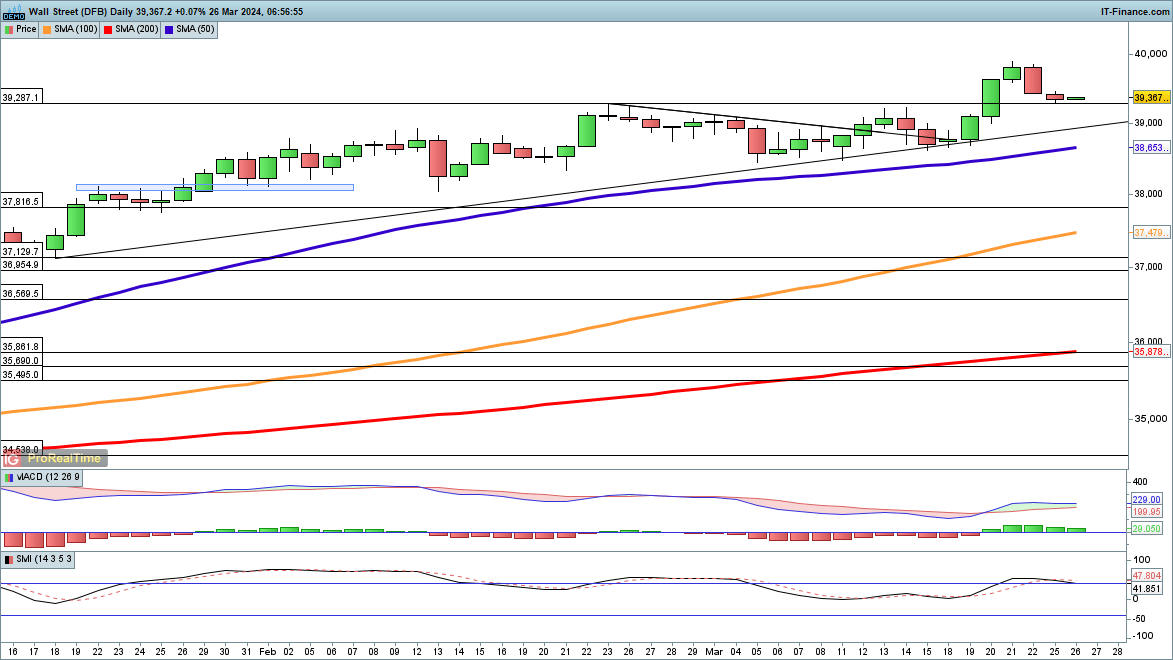
After pulling back from last week’s record high the index is finding support at the previous record high of 39,287.A close below this quickly brings rising trendline support from January into view. This provided support in the first half of March. Below this, the 50-day simple moving average (SMA) comes into play.
DowJones Daily Chart
| Change in | Longs | Shorts | OI |
| Daily | 29% | -6% | 3% |
| Weekly | 13% | -4% | 1% |
Nasdaq 100 back to new highs?
Monday’s low of 18,180 has found buyers, and early trading this morning has seen small gains that could put the price back on course to test the record high of 18,468 seen last week.
In the short-term, rising trendline support from January is nearby, as is the 50-day SMA. The index continues to trade without even a 5% pullback.
Nasdaq100 Daily Chart
Recommended by Chris Beauchamp
Recommended by Chris Beauchamp
Master The Three Market Conditions
Nikkei 225 edges lower
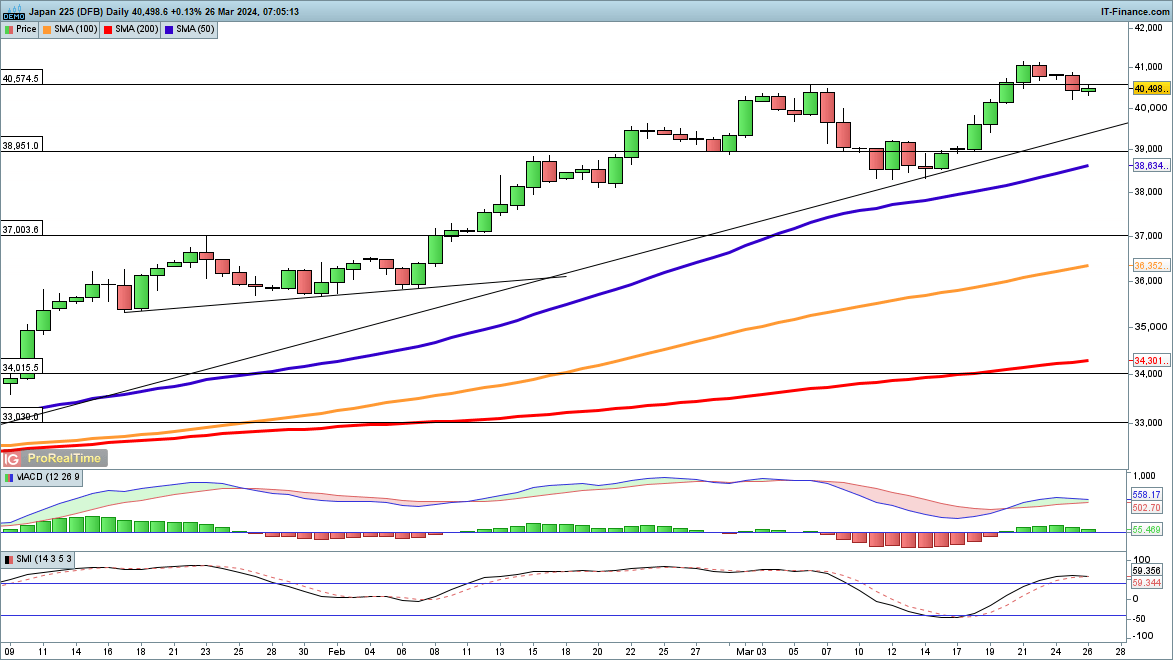
After the rally from the mid-March low, the index continues to drift lower. Trendline support from early January comes into view around 39,640, and then below this is horizontal support from the 1990 record high at 38,951.
The price has slipped below the early March high of 40,574, so a close back above here helps to restore a bullish short-term view.


