
Polkadot (DOT) is gaining pace above the $10.00 resistance against the US Dollar. The price could extend its rally toward the $12.00 level in the near term.
- DOT is gaining pace above the $9.80 and $10.00 levels against the US Dollar.
- The price is trading above the $10.00 zone and the 100 simple moving average (4 hours).
- There is a key bullish trend line forming with support at $9.10 on the 4-hour chart of the DOT/USD pair (data source from Kraken).
- The pair could continue to rise toward the $12 resistance zone.
Polkadot Price Resumes Rally
After forming a base above the $8.00 level, DOT price started a fresh rally. It gained over 20% in a few days and even outperformed Ethereum and Bitcoin at times.
There was a clear move above the $9.50 and $10.00 resistance levels. The price traded to a new multi-month high at $11.00 and is currently consolidating gains. There was a minor pullback below the $10.75 level. The price is still above the 23.6% Fib retracement level of the upward move from the $8.26 swing low to the $11.00 high.
DOT is now trading well above the $10.00 zone and the 100 simple moving average (4 hours). There is also a key bullish trend line forming with support at $9.10 on the 4-hour chart of the DOT/USD pair. The trend line is close to the 61.8% Fib retracement level of the upward move from the $8.26 swing low to the $11.00 high.
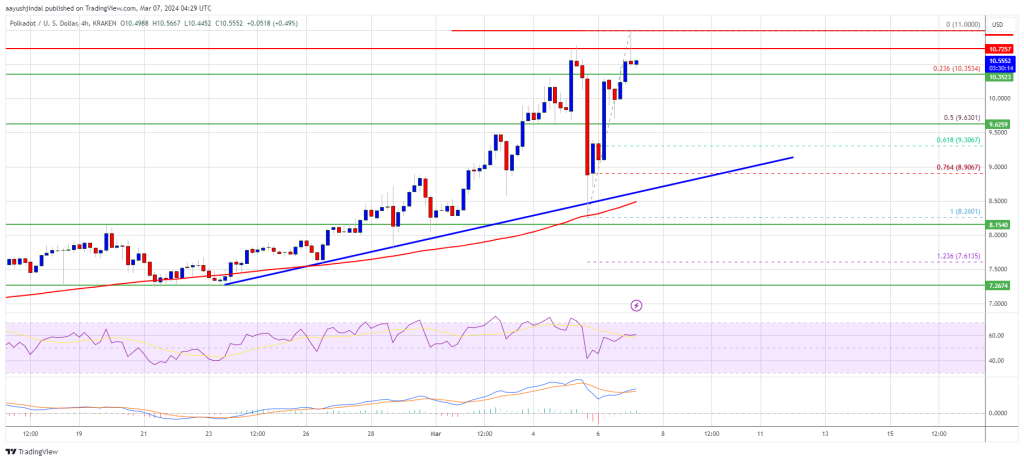
Source: DOTUSD on TradingView.com
Immediate resistance is near the $10.75 level. The next major resistance is near $11.00. A successful break above $11.00 could start another strong rally. In the stated case, the price could easily rally toward $12.00 in the near term. The next major resistance is seen near the $13.50 zone.
Are Dips Supported in DOT?
If DOT price fails to start a fresh increase above $11.00, it could start a downside correction. The first key support is near the $10.35 level.
The next major support is near the $10.00 level, below which the price might decline to $9.50. Any more losses may perhaps open the doors for a move toward the $9.20 support zone or the trend line.
Technical Indicators
4-Hours MACD – The MACD for DOT/USD is now gaining momentum in the bullish zone.
4-Hours RSI (Relative Strength Index) – The RSI for DOT/USD is now above the 50 level.
Major Support Levels – $10.35, $10.00 and $9.50.
Major Resistance Levels – $10.75, $11.00, and $12.00.
Disclaimer: The article is provided for educational purposes only. It does not represent the opinions of NewsBTC on whether to buy, sell or hold any investments and naturally investing carries risks. You are advised to conduct your own research before making any investment decisions. Use information provided on this website entirely at your own risk.